Message boards : News : Experimental Python tasks (beta) - task description
| Author | Message |
|---|---|
|
abouh Project administrator Project developer Project tester Project scientist Send message Joined: 31 May 21 Posts: 200 Credit: 0 RAC: 0 Level Scientific publications | |
|
Hello everyone, just wanted to give some updates about the machine learning - python jobs that Toni mentioned earlier in the "Experimental Python tasks (beta) " thread. | |
| ID: 56977 | Rating: 0 | rate:
| |
|
bozz4science Send message Joined: 22 May 20 Posts: 109 Credit: 68,936,176 RAC: 0 Level Scientific publications | |
|
Highly anticipated and overdue. Needless to say, kudos to you and your team for pushing the frontier on the computational abilities of the client software. Looking forward to contribute in the future, hopefully with more than I have at hand right now. "problems [so far] unattainable in smaller scale settings"? 5. What is the ultimate goal of this ML-project? Have only one latest gen trained agents group at the end that is the result of the continuous reinforeced learning iterations? Have several and test/benchmark them against each other? Thx! Keep up the great work! | |
| ID: 56978 | Rating: 0 | rate:
| |
|
Ian&Steve C. Send message Joined: 21 Feb 20 Posts: 1048 Credit: 40,228,383,983 RAC: 547,485 Level Scientific publications | |
|
will you be utilizing the tensor cores present in the nvidia RTX cards? the tensor cores are designed for this kind of workload. | |
| ID: 56979 | Rating: 0 | rate:
| |
 phi1258 phi1258  Send message Joined: 30 Jul 16 Posts: 4 Credit: 1,555,158,536 RAC: 5,099 Level Scientific publications | |
|
This is a welcome advance. Looking forward to contributing. | |
| ID: 56989 | Rating: 0 | rate:
| |
|
ServicEnginIC Send message Joined: 24 Sep 10 Posts: 572 Credit: 7,515,397,024 RAC: 10,445,831 Level Scientific publications | |
|
Thank you very much for this advance. | |
| ID: 56990 | Rating: 0 | rate:
| |
|
Wish you sucess. | |
| ID: 56994 | Rating: 0 | rate:
| |
|
Erich56 Send message Joined: 1 Jan 15 Posts: 1105 Credit: 7,822,620,176 RAC: 1,815,365 Level Scientific publications | |
|
Ian&Steve C. wrote on June 17th: will you be utilizing the tensor cores present in the nvidia RTX cards? the tensor cores are designed for this kind of workload. I am courious what the answer will be | |
| ID: 56996 | Rating: 0 | rate:
| |
|
Ian&Steve C. Send message Joined: 21 Feb 20 Posts: 1048 Credit: 40,228,383,983 RAC: 547,485 Level Scientific publications | |
|
also, can the team comment on not just GPU "under"utilization. these have NO GPU utilization. | |
| ID: 57000 | Rating: 0 | rate:
| |
|
ExtraTerrestrial Apes Volunteer moderator Volunteer tester Send message Joined: 17 Aug 08 Posts: 2705 Credit: 1,311,122,549 RAC: 0 Level Scientific publications | |
|
I understand this is basic research in ML. However, I wonder which problems it would be used for here. Personally I'm here for the bio-science. If the topic of the new ML research differs significantly and it seems to be successful based on first trials, I'd suggest to set it up as a seperate project. | |
| ID: 57009 | Rating: 0 | rate:
| |
|
bozz4science Send message Joined: 22 May 20 Posts: 109 Credit: 68,936,176 RAC: 0 Level Scientific publications | |
|
This is why I asked what "problems" are currently envisioned to be tackled by the resulting model. But IMO and understanding this is a ML project specifically set up to be trained on biomedical data sets. Thus, I'd argue that the science being done is still bio-related nonetheless. Would highly appreciate a feedback to loads of great questions here in this thread so far. | |
| ID: 57014 | Rating: 0 | rate:
| |
|
Retvari Zoltan Send message Joined: 20 Jan 09 Posts: 2343 Credit: 16,201,255,749 RAC: 0 Level Scientific publications | |
| ID: 57020 | Rating: 0 | rate:
| |
|
mmonnin Send message Joined: 2 Jul 16 Posts: 333 Credit: 4,989,276,065 RAC: 18,484,343 Level Scientific publications | |
|
I noticed some python tasks in my task history. All failed for me and failed so far for everyone else. Has anyone completed any? | |
| ID: 58044 | Rating: 0 | rate:
| |
|
Richard Haselgrove Send message Joined: 11 Jul 09 Posts: 1589 Credit: 6,676,344,351 RAC: 9,081,515 Level Scientific publications | |
|
Host 132158 is getting some. The first failed with: File "/tmp/pip-install-kvyy94ud/atari-py_bc0e384c30f043aca5cad42554937b02/setup.py", line 28, in run sys.stderr.write("Unable to execute '{}'. HINT: are you sure `make` is installed?\n".format(' '.join(cmd))) NameError: name 'cmd' is not defined ---------------------------------------- ERROR: Failed building wheel for atari-py ERROR: Command errored out with exit status 1: command: /var/lib/boinc-client/slots/0/gpugridpy/bin/python -u -c 'import io, os, sys, setuptools, tokenize; sys.argv[0] = '"'"'/tmp/pip-install-kvyy94ud/atari-py_bc0e384c30f043aca5cad42554937b02/setup.py'"'"'; __file__='"'"'/tmp/pip-install-kvyy94ud/atari-py_bc0e384c30f043aca5cad42554937b02/setup.py'"'"';f = getattr(tokenize, '"'"'open'"'"', open)(__file__) if os.path.exists(__file__) else io.StringIO('"'"'from setuptools import setup; setup()'"'"');code = f.read().replace('"'"'\r\n'"'"', '"'"'\n'"'"');f.close();exec(compile(code, __file__, '"'"'exec'"'"'))' install --record /tmp/pip-record-k6sefcno/install-record.txt --single-version-externally-managed --compile --install-headers /var/lib/boinc-client/slots/0/gpugridpy/include/python3.8/atari-py cwd: /tmp/pip-install-kvyy94ud/atari-py_bc0e384c30f043aca5cad42554937b02/ Looks like a typo. | |
| ID: 58045 | Rating: 0 | rate:
| |
|
Keith Myers Send message Joined: 13 Dec 17 Posts: 1313 Credit: 6,016,967,459 RAC: 9,922,728 Level Scientific publications | |
|
Shame the tasks are misconfigured. I ran through a dozen of them on a host with errors. With the scarcity of work, every little bit is appreciated and can be used. | |
| ID: 58058 | Rating: 0 | rate:
| |
|
Keith Myers Send message Joined: 13 Dec 17 Posts: 1313 Credit: 6,016,967,459 RAC: 9,922,728 Level Scientific publications | |
|
@abouh, could you check your configuration again? The tasks are failing during the build process with cmake. cmake normally isn't installed in Linux and when it is it is not normally installed into the PATH environment. | |
| ID: 58061 | Rating: 0 | rate:
| |
|
abouh Project administrator Project developer Project tester Project scientist Send message Joined: 31 May 21 Posts: 200 Credit: 0 RAC: 0 Level Scientific publications | |
|
Hello everyone, sorry for the late reply. | |
| ID: 58104 | Rating: 0 | rate:
| |
|
Richard Haselgrove Send message Joined: 11 Jul 09 Posts: 1589 Credit: 6,676,344,351 RAC: 9,081,515 Level Scientific publications | |
|
Multiple different failure modes among the four hosts that have failed (so far) to run workunit 27102466. | |
| ID: 58112 | Rating: 0 | rate:
| |
|
abouh Project administrator Project developer Project tester Project scientist Send message Joined: 31 May 21 Posts: 200 Credit: 0 RAC: 0 Level Scientific publications | |
|
The error reported in the job with result ID 32730901 is due to a conda environment error detected and solved during previous testing bouts. | |
| ID: 58114 | Rating: 0 | rate:
| |
|
Richard Haselgrove Send message Joined: 11 Jul 09 Posts: 1589 Credit: 6,676,344,351 RAC: 9,081,515 Level Scientific publications | |
|
OK, I've reset both my Linux hosts. Fortunately I'm on a fast line for the replacement download... | |
| ID: 58115 | Rating: 0 | rate:
| |
|
Richard Haselgrove Send message Joined: 11 Jul 09 Posts: 1589 Credit: 6,676,344,351 RAC: 9,081,515 Level Scientific publications | |
|
Task e1a15-ABOU_rnd_ppod_3-0-1-RND2976_3 was the first to run after the reset, but unfortunately it failed too. | |
| ID: 58116 | Rating: 0 | rate:
| |
|
Ian&Steve C. Send message Joined: 21 Feb 20 Posts: 1048 Credit: 40,228,383,983 RAC: 547,485 Level Scientific publications | |
|
I reset the project on my host. still failed. | |
| ID: 58117 | Rating: 0 | rate:
| |
|
Keith Myers Send message Joined: 13 Dec 17 Posts: 1313 Credit: 6,016,967,459 RAC: 9,922,728 Level Scientific publications | |
|
I couldn't get your imgur image to load, just a spinner. | |
| ID: 58118 | Rating: 0 | rate:
| |
|
Ian&Steve C. Send message Joined: 21 Feb 20 Posts: 1048 Credit: 40,228,383,983 RAC: 547,485 Level Scientific publications | |
|
Yeah I get a message that Imgur is over capacity (first time I’ve ever seen that). Their site must be having maintenance or getting hammered. It was working earlier. I guess just try again a little later. | |
| ID: 58119 | Rating: 0 | rate:
| |
|
mmonnin Send message Joined: 2 Jul 16 Posts: 333 Credit: 4,989,276,065 RAC: 18,484,343 Level Scientific publications | |
|
I've had two tasks complete on a host that was previously erroring out: | |
| ID: 58120 | Rating: 0 | rate:
| |
|
abouh Project administrator Project developer Project tester Project scientist Send message Joined: 31 May 21 Posts: 200 Credit: 0 RAC: 0 Level Scientific publications | |
|
Hello everyone, | |
| ID: 58123 | Rating: 0 | rate:
| |
|
abouh Project administrator Project developer Project tester Project scientist Send message Joined: 31 May 21 Posts: 200 Credit: 0 RAC: 0 Level Scientific publications | |
|
Yes I was progressively testing for how many steps the Agents could be trained and I forgot to increase the credits proportionally to the training steps. I will correct that in the immediate next batch, sorry and thanks for making us notice. | |
| ID: 58124 | Rating: 0 | rate:
| |
|
PDW Send message Joined: 7 Mar 14 Posts: 15 Credit: 1,919,657,025 RAC: 25,514,933 Level Scientific publications | |
|
On mine, free memory (as reported in top) dropped from approximately 25,500 (when running an ACEMD task) to 7,000. | |
| ID: 58125 | Rating: 0 | rate:
| |
|
Ian&Steve C. Send message Joined: 21 Feb 20 Posts: 1048 Credit: 40,228,383,983 RAC: 547,485 Level Scientific publications | |
|
thanks for the clarification. | |
| ID: 58127 | Rating: 0 | rate:
| |
|
Richard Haselgrove Send message Joined: 11 Jul 09 Posts: 1589 Credit: 6,676,344,351 RAC: 9,081,515 Level Scientific publications | |
I agree with PDW that running work on all CPUs threads when BOINC expects at most that 1 CPU thread will be used will be problematic for most users who run CPU work from other projects. The normal way of handling that is to use the [MT] (multi-threaded) plan class mechanism in BOINC - these trial apps are being issued using the same [cuda1121] plan class as the current ACEMD production work. Having said that, it might be quite tricky to devise a combined [CUDA + MT] plan class. BOINC code usually expects a simple-minded either/or solution, not a combination. And I don't really like the standard MT implementation, which defaults to using every possible CPU core in the volunteer's computer. Not polite. MT can be tamed by using an app_config.xml or app_info.xml file, but you may need to tweak both <cpu_usage> (for BOINC scheduling purposes) and something like a command line parameter to control the spawning behaviour of the app. | |
| ID: 58132 | Rating: 0 | rate:
| |
|
Ian&Steve C. Send message Joined: 21 Feb 20 Posts: 1048 Credit: 40,228,383,983 RAC: 547,485 Level Scientific publications | |
|
given the current state of these beta tasks, I have done the following on my 7xGPU 48-thread system. allowed only 3x Python Beta tasks to run since the systems only have 64GB ram and each process is using ~20GB. <app_config> <app> <name>acemd3</name> <gpu_versions> <cpu_usage>1.0</cpu_usage> <gpu_usage>1.0</gpu_usage> </gpu_versions> </app> <app> <name>PythonGPU</name> <gpu_versions> <cpu_usage>5.0</cpu_usage> <gpu_usage>1.0</gpu_usage> </gpu_versions> <max_concurrent>3</max_concurrent> </app> </app_config> will see how it works out when more python beta tasks flow. and adjust as the project adjusts settings. abouh, before you start releasing more beta tasks, could you give us a heads up to what we should expect and/or what you changed about them? ____________  | |
| ID: 58134 | Rating: 0 | rate:
| |
|
Keith Myers Send message Joined: 13 Dec 17 Posts: 1313 Credit: 6,016,967,459 RAC: 9,922,728 Level Scientific publications | |
|
I finished up a python gpu task last night on one host and saw it spawned a ton of processes that used up 17GB of system memory. I have 32GB minimum in all my hosts and it was not a problem. | |
| ID: 58135 | Rating: 0 | rate:
| |
|
Ian&Steve C. Send message Joined: 21 Feb 20 Posts: 1048 Credit: 40,228,383,983 RAC: 547,485 Level Scientific publications | |
I finished up a python gpu task last night on one host and saw it spawned a ton of processes that used up 17GB of system memory. I have 32GB minimum in all my hosts and it was not a problem. Good to know Keith. Did you by chance get a look at GPU utilization? Or CPU thread utilization of the spawns? ____________ | |
| ID: 58136 | Rating: 0 | rate:
| |
|
Keith Myers Send message Joined: 13 Dec 17 Posts: 1313 Credit: 6,016,967,459 RAC: 9,922,728 Level Scientific publications | |
I finished up a python gpu task last night on one host and saw it spawned a ton of processes that used up 17GB of system memory. I have 32GB minimum in all my hosts and it was not a problem. Gpu utilization was at 3%. Each spawn used up about 170MB of memory and fluctuated around 13-17% cpu utilization. | |
| ID: 58137 | Rating: 0 | rate:
| |
|
Ian&Steve C. Send message Joined: 21 Feb 20 Posts: 1048 Credit: 40,228,383,983 RAC: 547,485 Level Scientific publications | |
|
good to know. so what I experienced was pretty similar. | |
| ID: 58138 | Rating: 0 | rate:
| |
|
Keith Myers Send message Joined: 13 Dec 17 Posts: 1313 Credit: 6,016,967,459 RAC: 9,922,728 Level Scientific publications | |
|
Yes primarily Universe and a few TN-Grid tasks were running also. | |
| ID: 58140 | Rating: 0 | rate:
| |
|
abouh Project administrator Project developer Project tester Project scientist Send message Joined: 31 May 21 Posts: 200 Credit: 0 RAC: 0 Level Scientific publications | |
|
I will send some more tasks later today with similar requirements as the last ones, with 32 multithreading reinforcement learning environments running in parallel for the agent to interact with. | |
| ID: 58141 | Rating: 0 | rate:
| |
|
Ian&Steve C. Send message Joined: 21 Feb 20 Posts: 1048 Credit: 40,228,383,983 RAC: 547,485 Level Scientific publications | |
|
I got 3 of them just now. all failed with tracebacks after several minutes of run time. seems like there's still some coding bugs in the application. all wingmen are failing similarly: | |
| ID: 58143 | Rating: 0 | rate:
| |
|
Ian&Steve C. Send message Joined: 21 Feb 20 Posts: 1048 Credit: 40,228,383,983 RAC: 547,485 Level Scientific publications | |
|
the new one I just got seems to be doing better. less CPU use, and it looks like i'm seeing the mentioned 60-80% spikes on the GPU occasionally. | |
| ID: 58144 | Rating: 0 | rate:
| |
|
abouh Project administrator Project developer Project tester Project scientist Send message Joined: 31 May 21 Posts: 200 Credit: 0 RAC: 0 Level Scientific publications | |
|
I normally test the jobs locally first, to then run a couple of small batches of tasks in GPUGrid in case some error that did not appear locally occurs. The first small batch failed so I could fix the error in the second one. Now that the second batch succeeded will send a bigger batch of tasks. | |
| ID: 58145 | Rating: 0 | rate:
| |
|
Keith Myers Send message Joined: 13 Dec 17 Posts: 1313 Credit: 6,016,967,459 RAC: 9,922,728 Level Scientific publications | |
|
I must be crunching one of the fixed second batch currently on this daily driver. Seems to be progressing nicely. | |
| ID: 58146 | Rating: 0 | rate:
| |
|
Ian&Steve C. Send message Joined: 21 Feb 20 Posts: 1048 Credit: 40,228,383,983 RAC: 547,485 Level Scientific publications | |
|
these new ones must be pretty long. | |
| ID: 58147 | Rating: 0 | rate:
| |
|
kksplace Send message Joined: 4 Mar 18 Posts: 53 Credit: 1,816,656,749 RAC: 6,127,494 Level Scientific publications | |
|
I got the first one of the Python WUs for me, and am a little concerned. After 3.25 hours it is only 10% complete. GPU usage seems to be about what you all are saying, and same with CPU. However, I also only have 8 cores/16 threads, with 6 other CPU work units running (TN Grid and Rosetta 4.2). Should I be limiting the other work to let these run? (16 GB RAM). | |
| ID: 58148 | Rating: 0 | rate:
| |
|
Keith Myers Send message Joined: 13 Dec 17 Posts: 1313 Credit: 6,016,967,459 RAC: 9,922,728 Level Scientific publications | |
|
I don't think BOINC knows how to handle interpreting the estimated run_times of these Python tasks. I wouldn't worry about it. | |
| ID: 58149 | Rating: 0 | rate:
| |
|
Ian&Steve C. Send message Joined: 21 Feb 20 Posts: 1048 Credit: 40,228,383,983 RAC: 547,485 Level Scientific publications | |
|
I had the same feeling, Keith | |
| ID: 58150 | Rating: 0 | rate:
| |
|
Ian&Steve C. Send message Joined: 21 Feb 20 Posts: 1048 Credit: 40,228,383,983 RAC: 547,485 Level Scientific publications | |
|
also those of us running these, should probably prepare for VERY low credit reward. | |
| ID: 58151 | Rating: 0 | rate:
| |
|
Keith Myers Send message Joined: 13 Dec 17 Posts: 1313 Credit: 6,016,967,459 RAC: 9,922,728 Level Scientific publications | |
|
I got one task early on that rewarded more than reasonable credit. | |
| ID: 58152 | Rating: 0 | rate:
| |
|
Ian&Steve C. Send message Joined: 21 Feb 20 Posts: 1048 Credit: 40,228,383,983 RAC: 547,485 Level Scientific publications | |
|
That task was short though. The threshold is around 2million credit reward if I remember. | |
| ID: 58153 | Rating: 0 | rate:
| |
|
Ian&Steve C. Send message Joined: 21 Feb 20 Posts: 1048 Credit: 40,228,383,983 RAC: 547,485 Level Scientific publications | |
|
confirmed. Peak FLOP Count One-time cheats ____________ | |
| ID: 58154 | Rating: 0 | rate:
| |
|
Keith Myers Send message Joined: 13 Dec 17 Posts: 1313 Credit: 6,016,967,459 RAC: 9,922,728 Level Scientific publications | |
|
Yep, I saw that. Same credit as before and now I remember this bit of code being brought up before back in the old Seti days. | |
| ID: 58155 | Rating: 0 | rate:
| |
|
Aurum Send message Joined: 12 Jul 17 Posts: 400 Credit: 13,821,664,882 RAC: 29,957,975 Level Scientific publications | |
|
Awoke to find 4 PythonGPU WUs running on 3 computers. All had OPN & TN-Grid WUs running with CPU use flat-lined at 100%. Suspended all other CPU WUs to see what PG was using and got a band mostly contained in the range 20 to 40%. Then I tried a couple of scenarios. | |
| ID: 58157 | Rating: 0 | rate:
| |
|
Ian&Steve C. Send message Joined: 21 Feb 20 Posts: 1048 Credit: 40,228,383,983 RAC: 547,485 Level Scientific publications | |
|
I did something similar with my two 7xGPU systems. | |
| ID: 58158 | Rating: 0 | rate:
| |
|
abouh Project administrator Project developer Project tester Project scientist Send message Joined: 31 May 21 Posts: 200 Credit: 0 RAC: 0 Level Scientific publications | |
|
Hello everyone, | |
| ID: 58161 | Rating: 0 | rate:
| |
|
Ian&Steve C. Send message Joined: 21 Feb 20 Posts: 1048 Credit: 40,228,383,983 RAC: 547,485 Level Scientific publications | |
|
thanks! | |
| ID: 58162 | Rating: 0 | rate:
| |
|
ServicEnginIC Send message Joined: 24 Sep 10 Posts: 572 Credit: 7,515,397,024 RAC: 10,445,831 Level Scientific publications | |
1. Detected multiple CUDA out of memory errors. Locally the jobs use 6GB of GPU memory. It seems difficult to lower the GPU memory requirements for now, so jobs running in GPUs with less memory should fail. I've tried to set preferences at all my less than 6GB RAM GPU hosts for not receiving Python Runtime (GPU, beta) app: Run only the selected applicationsACEMD3: yes But I've still received one more Python GPU task at one of them. This makes me to get in doubt whether GPUGRID preferences are currently working as intended or not... Task e1a1-ABOU_rnd_ppod_8-0-1-RND5560_0 RuntimeError: CUDA out of memory. | |
| ID: 58163 | Rating: 0 | rate:
| |
|
Erich56 Send message Joined: 1 Jan 15 Posts: 1105 Credit: 7,822,620,176 RAC: 1,815,365 Level Scientific publications | |
This makes me to get in doubt whether GPUGRID preferences are currently working as intended or not... my question is a different one: as long as the GPUGRID team now concentrates on Python, no more ACEMD tasks will come? | |
| ID: 58164 | Rating: 0 | rate:
| |
|
PDW Send message Joined: 7 Mar 14 Posts: 15 Credit: 1,919,657,025 RAC: 25,514,933 Level Scientific publications | |
But I've still received one more Python GPU task at one of them. I had the same problem, you need to set the 'Run test applications' to No It looks like having that set to Yes will over ride any specific application setting you set. | |
| ID: 58166 | Rating: 0 | rate:
| |
|
ServicEnginIC Send message Joined: 24 Sep 10 Posts: 572 Credit: 7,515,397,024 RAC: 10,445,831 Level Scientific publications | |
|
Thanks, I'll try | |
| ID: 58167 | Rating: 0 | rate:
| |
|
Keith Myers Send message Joined: 13 Dec 17 Posts: 1313 Credit: 6,016,967,459 RAC: 9,922,728 Level Scientific publications | |
This makes me to get in doubt whether GPUGRID preferences are currently working as intended or not... Hard to say. Toni and Gianni both stated the work would be very limited and infrequent until they can fill the new PhD positions. But there have been occasional "drive-by" drops of cryptic scout work I've noticed along with the occasional standard research acemd3 resend. Sounds like @abouh is getting ready to drop a larger debugged batch of Python on GPU tasks. | |
| ID: 58168 | Rating: 0 | rate:
| |
|
Erich56 Send message Joined: 1 Jan 15 Posts: 1105 Credit: 7,822,620,176 RAC: 1,815,365 Level Scientific publications | |
Sounds like @abouh is getting ready to drop a larger debugged batch of Python on GPU tasks. Would be great if they work on Windows, too :-) | |
| ID: 58169 | Rating: 0 | rate:
| |
|
abouh Project administrator Project developer Project tester Project scientist Send message Joined: 31 May 21 Posts: 200 Credit: 0 RAC: 0 Level Scientific publications | |
|
Today I will send a couple of batches with short tasks for some final debugging of the scripts and then later I will send a big batch of debugged tasks. | |
| ID: 58170 | Rating: 0 | rate:
| |
|
abouh Project administrator Project developer Project tester Project scientist Send message Joined: 31 May 21 Posts: 200 Credit: 0 RAC: 0 Level Scientific publications | |
|
The idea is to make it work for Windows in the future as well, once it works smoothly on linux. | |
| ID: 58171 | Rating: 0 | rate:
| |
|
Ian&Steve C. Send message Joined: 21 Feb 20 Posts: 1048 Credit: 40,228,383,983 RAC: 547,485 Level Scientific publications | |
|
Thanks, looks like they are small enough to fit on a 16GB system now. using about 12GB. | |
| ID: 58172 | Rating: 0 | rate:
| |
|
Ian&Steve C. Send message Joined: 21 Feb 20 Posts: 1048 Credit: 40,228,383,983 RAC: 547,485 Level Scientific publications | |
Thanks, looks like they are small enough to fit on a 16GB system now. using about 12GB. not sure what happened to it. take a look. https://gpugrid.net/result.php?resultid=32731651 ____________ | |
| ID: 58173 | Rating: 0 | rate:
| |
|
Keith Myers Send message Joined: 13 Dec 17 Posts: 1313 Credit: 6,016,967,459 RAC: 9,922,728 Level Scientific publications | |
|
Looks like a needed package was not retrieved properly with a "deadline exceeded" error. | |
| ID: 58174 | Rating: 0 | rate:
| |
|
Ian&Steve C. Send message Joined: 21 Feb 20 Posts: 1048 Credit: 40,228,383,983 RAC: 547,485 Level Scientific publications | |
Looks like a needed package was not retrieved properly with a "deadline exceeded" error. It's interesting, looking at the stderr output. it appears that this app is communicating over the internet to send and receive data outside of BOINC. and to servers that are not belonging to the project. (i think the issue is that I was connected to my VPN checking something else and I left the connection active and it might have had an issue reaching the site it was trying to access) not sure how kosher that is. I think BOINC devs don't intend/desire this kind of behavior. some people might have some security concerns of the app doing these things outside of BOINC. might be a little smoother to do all communication only between the host and the project and only via the BOINC framework. if data needs to be uploaded elsewhere, it might be better for the project to do that on the backend. just my .02 ____________ | |
| ID: 58175 | Rating: 0 | rate:
| |
|
Aurum Send message Joined: 12 Jul 17 Posts: 400 Credit: 13,821,664,882 RAC: 29,957,975 Level Scientific publications | |
1. Detected multiple CUDA out of memory errors. Locally the jobs use 6GB of GPU memory. It seems difficult to lower the GPU memory requirements for now, so jobs running in GPUs with less memory should fail. I'm getting CUDA out of memory failures and all my cards have 10 to 12 GB of GDDR: 1080 Ti, 2080 Ti, 3080 Ti and 3080. There must be something else going on. I've also stopped trying to time-slice with PythonGPU. It should have a dedicated GPU and I'm leaving 32 CPU threads open for it. I keep looking for Pinocchio but have yet to see him. Where does it come from? Maybe I never got it. | |
| ID: 58176 | Rating: 0 | rate:
| |
|
Erich56 Send message Joined: 1 Jan 15 Posts: 1105 Credit: 7,822,620,176 RAC: 1,815,365 Level Scientific publications | |
The idea is to make it work for Windows in the future as well, once it works smoothly on linux. okay, sounds good; thanks for the information | |
| ID: 58177 | Rating: 0 | rate:
| |
|
Keith Myers Send message Joined: 13 Dec 17 Posts: 1313 Credit: 6,016,967,459 RAC: 9,922,728 Level Scientific publications | |
|
I'm running one of the new batch and at first the task was only using 2.2GB of gpu memory but now it has clocked backup to 6.6GB of gpu memory. | |
| ID: 58178 | Rating: 0 | rate:
| |
|
Aurum Send message Joined: 12 Jul 17 Posts: 400 Credit: 13,821,664,882 RAC: 29,957,975 Level Scientific publications | |
|
Just had one that's listed as "aborted by user." I didn't abort it. | |
| ID: 58179 | Rating: 0 | rate:
| |
|
mmonnin Send message Joined: 2 Jul 16 Posts: 333 Credit: 4,989,276,065 RAC: 18,484,343 Level Scientific publications | |
|
RuntimeError: CUDA out of memory. Tried to allocate 112.00 MiB (GPU 0; 11.77 GiB total capacity; 3.05 GiB already allocated; 50.00 MiB free; 3.21 GiB reserved in total by PyTorch) If reserved memory is >> allocated memory try setting max_split_size_mb to avoid fragmentation. See documentation for Memory Management and PYTORCH_CUDA_ALLOC_CONF | |
| ID: 58180 | Rating: 0 | rate:
| |
|
Keith Myers Send message Joined: 13 Dec 17 Posts: 1313 Credit: 6,016,967,459 RAC: 9,922,728 Level Scientific publications | |
|
The ray errors are normal and can be ignored. | |
| ID: 58181 | Rating: 0 | rate:
| |
|
Keith Myers Send message Joined: 13 Dec 17 Posts: 1313 Credit: 6,016,967,459 RAC: 9,922,728 Level Scientific publications | |
1. Detected multiple CUDA out of memory errors. Locally the jobs use 6GB of GPU memory. It seems difficult to lower the GPU memory requirements for now, so jobs running in GPUs with less memory should fail. I'm not doing anything at all in mitigation for the Python on GPU tasks other than to only run one at a time. I've been successful in almost all cases other than the very first trial ones in each evolution. | |
| ID: 58182 | Rating: 0 | rate:
| |
|
abouh Project administrator Project developer Project tester Project scientist Send message Joined: 31 May 21 Posts: 200 Credit: 0 RAC: 0 Level Scientific publications | |
|
What was halved was the amount of Agent training per task, and therefore the total amount of time required to completed it. | |
| ID: 58183 | Rating: 0 | rate:
| |
|
abouh Project administrator Project developer Project tester Project scientist Send message Joined: 31 May 21 Posts: 200 Credit: 0 RAC: 0 Level Scientific publications | |
|
During the task, the performance of the Agent is intermittently sent to https://wandb.ai/ to track how the agent is doing in the environment as training progresses. It immensely helps to understand the behaviour of the agent and facilitates research, as it allows visualising the information in a structured way. | |
| ID: 58184 | Rating: 0 | rate:
| |
|
abouh Project administrator Project developer Project tester Project scientist Send message Joined: 31 May 21 Posts: 200 Credit: 0 RAC: 0 Level Scientific publications | |
|
Pinocchio probably only caused problems in a subset of hosts, as it was due to one of the firsts test batches having a wrong conda environment requirements file. It was a small batch. | |
| ID: 58185 | Rating: 0 | rate:
| |
|
Richard Haselgrove Send message Joined: 11 Jul 09 Posts: 1589 Credit: 6,676,344,351 RAC: 9,081,515 Level Scientific publications | |
|
My machines are probably just above the minimum spec for the current batches - 16 GB RAM, and 6 GB video RAM on a GTX 1660. | |
| ID: 58186 | Rating: 0 | rate:
| |
|
mmonnin Send message Joined: 2 Jul 16 Posts: 333 Credit: 4,989,276,065 RAC: 18,484,343 Level Scientific publications | |
What was halved was the amount of Agent training per task, and therefore the total amount of time required to completed it. Halved? I've got one at nearly 21.5 hours on a 3080Ti and still going | |
| ID: 58187 | Rating: 0 | rate:
| |
|
Richard Haselgrove Send message Joined: 11 Jul 09 Posts: 1589 Credit: 6,676,344,351 RAC: 9,081,515 Level Scientific publications | |
|
This shows the timing discrepancy, a few minutes before task 32731655 completed. | |
| ID: 58188 | Rating: 0 | rate:
| |
|
Ian&Steve C. Send message Joined: 21 Feb 20 Posts: 1048 Credit: 40,228,383,983 RAC: 547,485 Level Scientific publications | |
|
i still think the 5,000,000 GFLOPs count is far too low. since these run for 12-24hrs depending on host (GPU speed does not seem to be a factor in this since GPU utilization is so low, most likely CPU/memory bound) and there seems to be a bit of a discrepancy in run time per task. I had a task run for 9hrs on my 3080Ti, while another user claims 21+ hrs on his 3080Ti. and I've had several tasks get killed around 12hrs for exceeded time limit, while others ran for longer. lots of inconsistencies here. | |
| ID: 58189 | Rating: 0 | rate:
| |
|
Richard Haselgrove Send message Joined: 11 Jul 09 Posts: 1589 Credit: 6,676,344,351 RAC: 9,081,515 Level Scientific publications | |
|
Because this project still uses DCF, the 'exceeded time limit' problem should go away as soon as you can get a single task to complete. Both my machines with finished tasks are now showing realistic estimates, but with DCFs of 5+ and 10+ - I agree, the FLOPs estimate should be increased by that sort of multiplier to keep estimates balanced against other researchers' work for the project. | |
| ID: 58190 | Rating: 0 | rate:
| |
|
Ian&Steve C. Send message Joined: 21 Feb 20 Posts: 1048 Credit: 40,228,383,983 RAC: 547,485 Level Scientific publications | |
|
my system that completed a few tasks had a DCF of 36+ | |
| ID: 58191 | Rating: 0 | rate:
| |
|
Richard Haselgrove Send message Joined: 11 Jul 09 Posts: 1589 Credit: 6,676,344,351 RAC: 9,081,515 Level Scientific publications | |
checkpointing also still isn't working. See my screenshot. "CPU time since checkpoint: 16:24:44" | |
| ID: 58192 | Rating: 0 | rate:
| |
|
Richard Haselgrove Send message Joined: 11 Jul 09 Posts: 1589 Credit: 6,676,344,351 RAC: 9,081,515 Level Scientific publications | |
|
I've checked a sched_request when reporting. <result> <name>e1a26-ABOU_rnd_ppod_11-0-1-RND6936_0</name> <final_cpu_time>55983.300000</final_cpu_time> <final_elapsed_time>36202.136027</final_elapsed_time> That's task 32731632. So it's the server applying the 'sanity(?) check' "elapsed time not less than CPU time". That's right for a single core GPU task, but not right for a task with multithreaded CPU elements. | |
| ID: 58193 | Rating: 0 | rate:
| |
|
abouh Project administrator Project developer Project tester Project scientist Send message Joined: 31 May 21 Posts: 200 Credit: 0 RAC: 0 Level Scientific publications | |
|
As mentioned by Ian&Steve C., GPU speed influences only partially task completion time. | |
| ID: 58194 | Rating: 0 | rate:
| |
|
abouh Project administrator Project developer Project tester Project scientist Send message Joined: 31 May 21 Posts: 200 Credit: 0 RAC: 0 Level Scientific publications | |
|
I will look into the reported issues before sending the next batch, to see if I can find a solution for both the problem of jobs being killed due to “exceeded time limit” and the progress and checkpointing problems. | |
| ID: 58195 | Rating: 0 | rate:
| |
|
Richard Haselgrove Send message Joined: 11 Jul 09 Posts: 1589 Credit: 6,676,344,351 RAC: 9,081,515 Level Scientific publications | |
From what Ian&Steve C. mentioned, I understand that increasing the "Estimated Computation Size", however BOINC calculates that, could solve the problem of jobs being killed? The jobs reach us with a workunit description: <workunit> <name>e1a24-ABOU_rnd_ppod_11-0-1-RND1891</name> <app_name>PythonGPU</app_name> <version_num>401</version_num> <rsc_fpops_est>5000000000000000.000000</rsc_fpops_est> <rsc_fpops_bound>250000000000000000.000000</rsc_fpops_bound> <rsc_memory_bound>4000000000.000000</rsc_memory_bound> <rsc_disk_bound>10000000000.000000</rsc_disk_bound> <file_ref> <file_name>e1a24-ABOU_rnd_ppod_11-0-run</file_name> <open_name>run.py</open_name> <copy_file/> </file_ref> <file_ref> <file_name>e1a24-ABOU_rnd_ppod_11-0-data</file_name> <open_name>input.zip</open_name> <copy_file/> </file_ref> <file_ref> <file_name>e1a24-ABOU_rnd_ppod_11-0-requirements</file_name> <open_name>requirements.txt</open_name> <copy_file/> </file_ref> <file_ref> <file_name>e1a24-ABOU_rnd_ppod_11-0-input_enc</file_name> <open_name>input</open_name> <copy_file/> </file_ref> </workunit> It's the fourth line, '<rsc_fpops_est>', which causes the problem. The job size is given as the estimated number of floating point operations to be calculated, in total. BOINC uses this, along with the estimated speed of the device it's running on, to estimate how long the task will take. For a GPU app, it's usually the speed of the GPU that counts, but in this case - although it's described as a GPU app - the dominant factor might be the speed of the CPU. BOINC doesn't take any direct notice of that. The jobs are killed when they reach the duration calculated from the next line, '<rsc_fpops_bound>'. A quick and dirty fix while testing might be to increase that value even above the current 50x the original estimate, but that removes a valuable safeguard during normal running. | |
| ID: 58196 | Rating: 0 | rate:
| |
|
abouh Project administrator Project developer Project tester Project scientist Send message Joined: 31 May 21 Posts: 200 Credit: 0 RAC: 0 Level Scientific publications | |
|
I see, thank you very much for the info. I asked Toni to help me adjusting the "rsc_fpops_est" parameter. Hopefully the next jobs won't be aborted by the server. | |
| ID: 58197 | Rating: 0 | rate:
| |
|
Keith Myers Send message Joined: 13 Dec 17 Posts: 1313 Credit: 6,016,967,459 RAC: 9,922,728 Level Scientific publications | |
|
Thanks @abouh for working with us in debugging your application and work units. | |
| ID: 58198 | Rating: 0 | rate:
| |
|
ServicEnginIC Send message Joined: 24 Sep 10 Posts: 572 Credit: 7,515,397,024 RAC: 10,445,831 Level Scientific publications | |
|
Thank you for your kind support. During the task, the agent first interacts with the environments for a while, then uses the GPU to process the collected data and learn from it, then interacts again with the environments, and so on. This behavior can be seen at some tests described at my Managing non-high-end hosts thread. | |
| ID: 58200 | Rating: 0 | rate:
| |
|
abouh Project administrator Project developer Project tester Project scientist Send message Joined: 31 May 21 Posts: 200 Credit: 0 RAC: 0 Level Scientific publications | |
|
I just sent another batch of tasks. | |
| ID: 58201 | Rating: 0 | rate:
| |
|
ServicEnginIC Send message Joined: 24 Sep 10 Posts: 572 Credit: 7,515,397,024 RAC: 10,445,831 Level Scientific publications | |
I just sent another batch of tasks. Thank you very much for this kind of Christmas present! Merry Christmas to everyone crunchers worldwide 🎄✨ | |
| ID: 58202 | Rating: 0 | rate:
| |
|
Richard Haselgrove Send message Joined: 11 Jul 09 Posts: 1589 Credit: 6,676,344,351 RAC: 9,081,515 Level Scientific publications | |
|
1,000,000,000 GFLOPs - initial estimate 1690d 21:37:58. That should be enough! | |
| ID: 58203 | Rating: 0 | rate:
| |
|
ServicEnginIC Send message Joined: 24 Sep 10 Posts: 572 Credit: 7,515,397,024 RAC: 10,445,831 Level Scientific publications | |
I tested locally and the progress and the restart.chk files are correctly generated and updated. In a preliminary sight of one new Python GPU task received today: - Progress estimation is now working properly, updating by 0,9% increments. - Estimated computation size has raised to 1,000,000,000 GFLOPs, as also confirmed by Richard Haselgrove - Checkpointing seems to be working also, and is being stored at about every two minutes. - Learning cycle period has reduced to 11 seconds from 21 seconds observed at previous task. sudo nvidia-smi dmon - GPU dedicated RAM usage seems to have been reduced, but I don't know if enough for running at 4 GB RAM GPUs (?) - Currrent progress for task e1a20-ABOU_rnd_ppod_13-0-1-RND1192_0 is 28,9% after 2 hours and 13 minutes running. This leads to a total true execution time of about 7 hours and 41 minutes at my Host #569442 Well done! | |
| ID: 58204 | Rating: 0 | rate:
| |
|
Keith Myers Send message Joined: 13 Dec 17 Posts: 1313 Credit: 6,016,967,459 RAC: 9,922,728 Level Scientific publications | |
|
Same observed behavior. Gpu memory halved, progress indicator normal and GFLOPS in line with actual usage. | |
| ID: 58208 | Rating: 0 | rate:
| |
|
ServicEnginIC Send message Joined: 24 Sep 10 Posts: 572 Credit: 7,515,397,024 RAC: 10,445,831 Level Scientific publications | |
- GPU dedicated RAM usage seems to have been reduced, but I don't know if enough for running at 4 GB RAM GPUs (?) I'm answering to myself: I enabled Python GPU tasks requesting in my GTX 1650 SUPER 4 GB system, and I happened to catch this previously failed task e1a21-ABOU_rnd_ppod_13-0-1-RND2308_1 This task has passed the initial processing steps, and has reached the learning cycle phase. At this point, memory usage is just at the limit of the 4 GB GPU available RAM. Waiting to see whether this task will be succeeding or not. System RAM usage keeps being very high. 99% of the 16 GB available RAM at this system is currently in use. | |
| ID: 58209 | Rating: 0 | rate:
| |
|
Richard Haselgrove Send message Joined: 11 Jul 09 Posts: 1589 Credit: 6,676,344,351 RAC: 9,081,515 Level Scientific publications | |
- Currrent progress for task e1a20-ABOU_rnd_ppod_13-0-1-RND1192_0 is 28,9% after 2 hours and 13 minutes running. This leads to a total true execution time of about 7 hours and 41 minutes at my Host #569442 That's roughly the figure I got in the early stages of today's tasks. But task 32731884 has just finished with <result> <name>e1a17-ABOU_rnd_ppod_13-0-1-RND0389_3</name> <final_cpu_time>59637.190000</final_cpu_time> <final_elapsed_time>39080.805144</final_elapsed_time> That's very similar (and on the same machine) as the one I reported in message 58193. So I don't think the task duration has changed much: maybe the progress %age isn't quite linear (but not enough to worry about). | |
| ID: 58210 | Rating: 0 | rate:
| |
|
abouh Project administrator Project developer Project tester Project scientist Send message Joined: 31 May 21 Posts: 200 Credit: 0 RAC: 0 Level Scientific publications | |
|
Hello, 21:28:07 (152316): wrapper (7.7.26016): starting I have found an issue from Richard Haselgrove talking about this error: https://github.com/BOINC/boinc/issues/4125 It seems like the users getting this error could simply solve it by setting PrivateTmp=true. Is that correct? What is the appropriate way to modify that? ____________ | |
| ID: 58218 | Rating: 0 | rate:
| |
|
ServicEnginIC Send message Joined: 24 Sep 10 Posts: 572 Credit: 7,515,397,024 RAC: 10,445,831 Level Scientific publications | |
It seems like the users getting this error could simply solve it by setting PrivateTmp=true. Is that correct? What is the appropriate way to modify that? Right. I gave a step-by-step solution based on Richard Haselgrove finding at my Message #55986 It worked fine for all my hosts. | |
| ID: 58219 | Rating: 0 | rate:
| |
|
abouh Project administrator Project developer Project tester Project scientist Send message Joined: 31 May 21 Posts: 200 Credit: 0 RAC: 0 Level Scientific publications | |
|
Thank you! | |
| ID: 58220 | Rating: 0 | rate:
| |
|
Richard Haselgrove Send message Joined: 11 Jul 09 Posts: 1589 Credit: 6,676,344,351 RAC: 9,081,515 Level Scientific publications | |
|
Some new (to me) errors in https://www.gpugrid.net/result.php?resultid=32732017 | |
| ID: 58221 | Rating: 0 | rate:
| |
|
Ian&Steve C. Send message Joined: 21 Feb 20 Posts: 1048 Credit: 40,228,383,983 RAC: 547,485 Level Scientific publications | |
|
it seems checkpointing still isnt working correctly. | |
| ID: 58222 | Rating: 0 | rate:
| |
|
Keith Myers Send message Joined: 13 Dec 17 Posts: 1313 Credit: 6,016,967,459 RAC: 9,922,728 Level Scientific publications | |
|
I saw the same issue on my last task which was checkpointed past 20% yet reset to 10% upon restart. | |
| ID: 58223 | Rating: 0 | rate:
| |
|
ServicEnginIC Send message Joined: 24 Sep 10 Posts: 572 Credit: 7,515,397,024 RAC: 10,445,831 Level Scientific publications | |
- GPU dedicated RAM usage seems to have been reduced, but I don't know if enough for running at 4 GB RAM GPUs (?) Two of my hosts with 4 GB dedicated RAM GPUs have succeeded their latest Python GPU tasks so far. If it is planned to be kept GPU RAM requirements this way, it widens the app to a quite greater number of hosts. Also I happened to catch two simultaneous Python tasks at my triple GTX 1650 GPU host. I then urgently suspended requesting for Gpugrid tasks at BOINC Manager... Why? This host system RAM size is 32 GB. When the second Python task started, free system RAM decreased to 1% (!). I grossly estimate that environment for each Python task takes about 16 GB system RAM. I guess that an eventual third concurrent task might have crashed itself, or even crashed the whole three Python tasks due to lack of system RAM. I was watching to Psensor readings when the first of the two Python tasks finished, and then the free system memory drastically increased again from 1% to 38%. I also took a nvidia-smi screenshot, where can be seen that each Python task was respectively running at GPU 0 and GPU 1, while GPU 2 was processing a PrimeGrid CUDA GPU task. 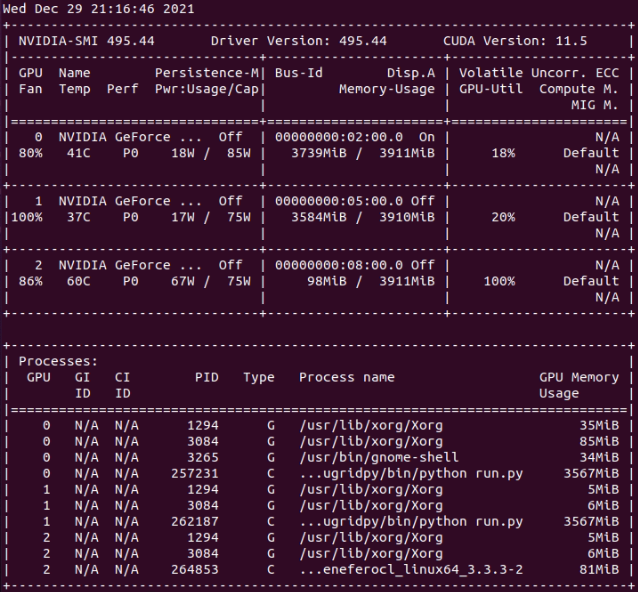 | |
| ID: 58225 | Rating: 0 | rate:
| |
|
Ian&Steve C. Send message Joined: 21 Feb 20 Posts: 1048 Credit: 40,228,383,983 RAC: 547,485 Level Scientific publications | |
|
now that I've upgraded my single 3080Ti host from a 5950X w/16GB ram to a 7402P/128GB ram, I want to see if I can even run 2x GPUGRID tasks on the same GPU. I see about 5GB VRAM use on the tasks I've processed so far. so with so much extra system ram and 12GB VRAM, it might work lol. | |
| ID: 58226 | Rating: 0 | rate:
| |
|
abouh Project administrator Project developer Project tester Project scientist Send message Joined: 31 May 21 Posts: 200 Credit: 0 RAC: 0 Level Scientific publications | |
|
Regarding the checkpointing problem, the approach I follow is to check the progress file (if exists) at the beginning of the python script and then continue the job from there. | |
| ID: 58227 | Rating: 0 | rate:
| |
|
mmonnin Send message Joined: 2 Jul 16 Posts: 333 Credit: 4,989,276,065 RAC: 18,484,343 Level Scientific publications | |
now that I've upgraded my single 3080Ti host from a 5950X w/16GB ram to a 7402P/128GB ram, I want to see if I can even run 2x GPUGRID tasks on the same GPU. I see about 5GB VRAM use on the tasks I've processed so far. so with so much extra system ram and 12GB VRAM, it might work lol. The last two tasks on my system with a 3080Ti ran concurrently and completed successfully. https://www.gpugrid.net/results.php?hostid=477247 | |
| ID: 58228 | Rating: 0 | rate:
| |
|
Richard Haselgrove Send message Joined: 11 Jul 09 Posts: 1589 Credit: 6,676,344,351 RAC: 9,081,515 Level Scientific publications | |
|
Errors in e6a12-ABOU_rnd_ppod_15-0-1-RND6167_2 (created today): | |
| ID: 58248 | Rating: 0 | rate:
| |
|
abouh Project administrator Project developer Project tester Project scientist Send message Joined: 31 May 21 Posts: 200 Credit: 0 RAC: 0 Level Scientific publications | |
|
One user mentioned that could not solve the error INTERNAL ERROR: cannot create temporary directory! This is the configuration he is using: ### Editing /etc/systemd/system/boinc-client.service.d/override.conf I was just wondering if there is any possible reason why it should not work ____________ | |
| ID: 58249 | Rating: 0 | rate:
| |
|
Richard Haselgrove Send message Joined: 11 Jul 09 Posts: 1589 Credit: 6,676,344,351 RAC: 9,081,515 Level Scientific publications | |
|
I am using a systemd file generated from a PPA maintained by Gianfranco Costamagna. It's automatically generated from Debian sources, and kept up-to-date with new releases automatically. It's currently supplying a BOINC suite labelled v7.16.17 [Unit] Description=Berkeley Open Infrastructure Network Computing Client Documentation=man:boinc(1) After=network-online.target [Service] Type=simple ProtectHome=true PrivateTmp=true ProtectSystem=strict ProtectControlGroups=true ReadWritePaths=-/var/lib/boinc -/etc/boinc-client Nice=10 User=boinc WorkingDirectory=/var/lib/boinc ExecStart=/usr/bin/boinc ExecStop=/usr/bin/boinccmd --quit ExecReload=/usr/bin/boinccmd --read_cc_config ExecStopPost=/bin/rm -f lockfile IOSchedulingClass=idle # The following options prevent setuid root as they imply NoNewPrivileges=true # Since Atlas requires setuid root, they break Atlas # In order to improve security, if you're not using Atlas, # Add these options to the [Service] section of an override file using # sudo systemctl edit boinc-client.service #NoNewPrivileges=true #ProtectKernelModules=true #ProtectKernelTunables=true #RestrictRealtime=true #RestrictAddressFamilies=AF_INET AF_INET6 AF_UNIX #RestrictNamespaces=true #PrivateUsers=true #CapabilityBoundingSet= #MemoryDenyWriteExecute=true [Install] WantedBy=multi-user.target That has the 'PrivateTmp=true' line in the [Service] section of the file, rather than isolated at the top as in your example. I don't know Linux well enough to know how critical the positioning is. We had long discussions in the BOINC development community a couple of years ago, when it was discovered that the 'PrivateTmp=true' setting blocked access to BOINC's X-server based idle detection. The default setting was reversed for a while, until it was discovered that the reverse 'PrivateTmp=false' setting caused the problem creating temporary directories that we observe here. I think that the default setting was reverted to true, but the discussion moved into the darker reaches of the Linux package maintenance managers, and the BOINC development cycle became somewhat disjointed. I'm no longer fully up-to-date with the state of play. | |
| ID: 58250 | Rating: 0 | rate:
| |
|
Richard Haselgrove Send message Joined: 11 Jul 09 Posts: 1589 Credit: 6,676,344,351 RAC: 9,081,515 Level Scientific publications | |
|
A simpler answer might be ### Lines below this comment will be discarded so the file as posted won't do anything at all - in particular, it won't run BOINC! | |
| ID: 58251 | Rating: 0 | rate:
| |
|
abouh Project administrator Project developer Project tester Project scientist Send message Joined: 31 May 21 Posts: 200 Credit: 0 RAC: 0 Level Scientific publications | |
|
Thank you! I reviewed the code and detected the source of the error. I am currently working to solve it. | |
| ID: 58253 | Rating: 0 | rate:
| |
|
Richard Haselgrove Send message Joined: 11 Jul 09 Posts: 1589 Credit: 6,676,344,351 RAC: 9,081,515 Level Scientific publications | |
|
Everybody seems to be getting the same error in today's tasks: | |
| ID: 58254 | Rating: 0 | rate:
| |
|
Keith Myers Send message Joined: 13 Dec 17 Posts: 1313 Credit: 6,016,967,459 RAC: 9,922,728 Level Scientific publications | |
|
I believe I got one of the test, fixed tasks this morning based on the short crunch time and valid report. | |
| ID: 58255 | Rating: 0 | rate:
| |
|
Richard Haselgrove Send message Joined: 11 Jul 09 Posts: 1589 Credit: 6,676,344,351 RAC: 9,081,515 Level Scientific publications | |
|
Yes, your workunit was "created 7 Jan 2022 | 17:50:07 UTC" - that's a couple of hours after the ones I saw. | |
| ID: 58256 | Rating: 0 | rate:
| |
|
abouh Project administrator Project developer Project tester Project scientist Send message Joined: 31 May 21 Posts: 200 Credit: 0 RAC: 0 Level Scientific publications | |
|
I just sent a batch that seems to fail with File "/var/lib/boinc-client/slots/30/python_dependencies/ppod_buffer_v2.py", line 325, in before_gradients For some reason it did not crash locally. "Fortunately" it will crash after only a few minutes, and it is easy to solve. I am very sorry for the inconvenience... I will send also a corrected batch with tasks of normal duration. I have tried to reduce the GPU memory requirements a bit in the new tasks. ____________ | |
| ID: 58263 | Rating: 0 | rate:
| |
|
Richard Haselgrove Send message Joined: 11 Jul 09 Posts: 1589 Credit: 6,676,344,351 RAC: 9,081,515 Level Scientific publications | |
|
Got one of those - failed as you describe. | |
| ID: 58264 | Rating: 0 | rate:
| |
|
FritzB Send message Joined: 7 Apr 15 Posts: 11 Credit: 2,374,441,100 RAC: 11,247,192 Level Scientific publications | |
|
I got 20 bad WU's today on this host: https://www.gpugrid.net/results.php?hostid=520456 Stderr Ausgabe <core_client_version>7.16.6</core_client_version> <![CDATA[ <message> process exited with code 195 (0xc3, -61)</message> <stderr_txt> 13:25:53 (6392): wrapper (7.7.26016): starting 13:25:53 (6392): wrapper (7.7.26016): starting 13:25:53 (6392): wrapper: running /usr/bin/flock (/var/lib/boinc-client/projects/www.gpugrid.net/miniconda.lock -c "/bin/bash ./miniconda-installer.sh -b -u -p /var/lib/boinc-client/projects/www.gpugrid.net/miniconda && /var/lib/boinc-client/projects/www.gpugrid.net/miniconda/bin/conda install -m -y -p gpugridpy --file requirements.txt ") 0%| | 0/45 [00:00<?, ?it/s] concurrent.futures.process._RemoteTraceback: ''' Traceback (most recent call last): File "concurrent/futures/process.py", line 368, in _queue_management_worker File "multiprocessing/connection.py", line 251, in recv TypeError: __init__() missing 1 required positional argument: 'msg' ''' The above exception was the direct cause of the following exception: Traceback (most recent call last): File "entry_point.py", line 69, in <module> File "concurrent/futures/process.py", line 484, in _chain_from_iterable_of_lists File "concurrent/futures/_base.py", line 611, in result_iterator File "concurrent/futures/_base.py", line 439, in result File "concurrent/futures/_base.py", line 388, in __get_result concurrent.futures.process.BrokenProcessPool: A process in the process pool was terminated abruptly while the future was running or pending. [6689] Failed to execute script entry_point 13:25:58 (6392): /usr/bin/flock exited; CPU time 3.906269 13:25:58 (6392): app exit status: 0x1 13:25:58 (6392): called boinc_finish(195) </stderr_txt> ]]> | |
| ID: 58265 | Rating: 0 | rate:
| |
|
Keith Myers Send message Joined: 13 Dec 17 Posts: 1313 Credit: 6,016,967,459 RAC: 9,922,728 Level Scientific publications | |
|
I errored out 12 tasks created from 10:09:55 to 10:40:06. | |
| ID: 58266 | Rating: 0 | rate:
| |
|
Keith Myers Send message Joined: 13 Dec 17 Posts: 1313 Credit: 6,016,967,459 RAC: 9,922,728 Level Scientific publications | |
|
And two of those were the batch error resends that now have failed. | |
| ID: 58268 | Rating: 0 | rate:
| |
|
Richard Haselgrove Send message Joined: 11 Jul 09 Posts: 1589 Credit: 6,676,344,351 RAC: 9,081,515 Level Scientific publications | |
|
You need to look at the creation time of the master WU, not of the individual tasks (which will vary, even within a WU, let alone a batch of WUs). | |
| ID: 58269 | Rating: 0 | rate:
| |
|
abouh Project administrator Project developer Project tester Project scientist Send message Joined: 31 May 21 Posts: 200 Credit: 0 RAC: 0 Level Scientific publications | |
|
I have seen this error a few times. concurrent.futures.process.BrokenProcessPool: A process in the process pool was terminated abruptly while the future was running or pending. Do you think it could be due to a lack of resources? I think Linux starts killing processes if you are over capacity. ____________ | |
| ID: 58270 | Rating: 0 | rate:
| |
|
Keith Myers Send message Joined: 13 Dec 17 Posts: 1313 Credit: 6,016,967,459 RAC: 9,922,728 Level Scientific publications | |
|
Might be the OOM-Killer kicking in. You would need to grep -i kill /var/log/messages* to check if processes were killed by the OOM-Killer. If that is the case you would have to configure /etc/sysctl.conf to let the system be less sensitive to brief out of memory conditions. | |
| ID: 58271 | Rating: 0 | rate:
| |
|
Richard Haselgrove Send message Joined: 11 Jul 09 Posts: 1589 Credit: 6,676,344,351 RAC: 9,081,515 Level Scientific publications | |
|
I Googled the error message, and came up with this stackoverflow thread. "The main module must be importable by worker subprocesses. This means that ProcessPoolExecutor will not work in the interactive interpreter. Calling Executor or Future methods from a callable submitted to a ProcessPoolExecutor will result in deadlock." Other search results may provide further clues. | |
| ID: 58272 | Rating: 0 | rate:
| |
|
abouh Project administrator Project developer Project tester Project scientist Send message Joined: 31 May 21 Posts: 200 Credit: 0 RAC: 0 Level Scientific publications | |
|
Thanks! out of the possible explanations that could cause the error listed in the thread, I suspect it could be OS killing the threads do to a lack of resources. Could be not enough RAM, or maybe python raises this error if the ratio cores / processes is high? (I have seen some machines with 4 CPUs, and the tasks spawns 32 reinforcement learning environments). | |
| ID: 58273 | Rating: 0 | rate:
| |
|
Keith Myers Send message Joined: 13 Dec 17 Posts: 1313 Credit: 6,016,967,459 RAC: 9,922,728 Level Scientific publications | |
|
What version of Python are the hosts that have the errors running? | |
| ID: 58274 | Rating: 0 | rate:
| |
|
ServicEnginIC Send message Joined: 24 Sep 10 Posts: 572 Credit: 7,515,397,024 RAC: 10,445,831 Level Scientific publications | |
What version of Python are the hosts that have the errors running? Same Python version as current mine. In case of doubt about conflicting Python versions, I published the solution that I applied to my hosts at Message #57833 It worked for my Ubuntu 20.04.3 LTS Linux distribution, but user mmonnin replied that this didn't work for him. mmonnin kindly published an alternative way at his Message #57840 | |
| ID: 58275 | Rating: 0 | rate:
| |
|
mmonnin Send message Joined: 2 Jul 16 Posts: 333 Credit: 4,989,276,065 RAC: 18,484,343 Level Scientific publications | |
|
I saw the prior post and was about to mention the same thing. Not sure which one works as the PC has been able to run tasks. | |
| ID: 58276 | Rating: 0 | rate:
| |
|
abouh Project administrator Project developer Project tester Project scientist Send message Joined: 31 May 21 Posts: 200 Credit: 0 RAC: 0 Level Scientific publications | |
|
All jobs should use the same python version (3.8.10), I define it in the requirements.txt file of the conda environment. | |
| ID: 58277 | Rating: 0 | rate:
| |
|
Keith Myers Send message Joined: 13 Dec 17 Posts: 1313 Credit: 6,016,967,459 RAC: 9,922,728 Level Scientific publications | |
|
I have a failed task today involving pickle. | |
| ID: 58278 | Rating: 0 | rate:
| |
|
SuperNanoCat Send message Joined: 3 Sep 21 Posts: 3 Credit: 51,773,232 RAC: 2,257,465 Level Scientific publications | |
|
The tasks run on my Tesla K20 for a while, but then fail when they need to use PyTorch, which requires higher CUDA Capability. Oh well. Guess I'll stick to the ACEMED tasks. The error output doesn't list the requirements properly, but from a little Googling, it was updated to require 3.7 within the past couple years. The only Kepler card that has 3.7 is the Tesla K80. [W NNPACK.cpp:79] Could not initialize NNPACK! Reason: Unsupported hardware. /var/lib/boinc-client/slots/2/gpugridpy/lib/python3.8/site-packages/torch/cuda/__init__.py:120: UserWarning: Found GPU%d %s which is of cuda capability %d.%d. PyTorch no longer supports this GPU because it is too old. The minimum cuda capability supported by this library is %d.%d. While I'm here, is there any way to force the project to update my hardware configuration? It thinks my host has two Quadro K620s instead of one of those and the Tesla. | |
| ID: 58279 | Rating: 0 | rate:
| |
|
Ian&Steve C. Send message Joined: 21 Feb 20 Posts: 1048 Credit: 40,228,383,983 RAC: 547,485 Level Scientific publications | |
While I'm here, is there any way to force the project to update my hardware configuration? It thinks my host has two Quadro K620s instead of one of those and the Tesla. this is a problem (feature?) of BOINC, not the project. the project only knows what hardware you have based on what BOINC communicates to the project. with cards from the same vendor (nvidia/AMD/Intel) BOINC only lists the "best" card and then appends a number that's associated with how many total devices you have from that vendor. it will only list different models if they are from different vendors. within the nvidia vendor group, BOINC figures out the "best" device by checking the compute capability first, then memory capacity, then some third metric that i cant remember right now. BOINC deems the K620 to be "best" because it has a higher compute capability (5.0) than the Tesla K20 (3.5) even though the K20 is arguably the better card with more/faster memory and more cores. all in all, this has nothing to do with the project, and everything to do with BOINC's GPU ranking code. ____________ | |
| ID: 58280 | Rating: 0 | rate:
| |
|
mmonnin Send message Joined: 2 Jul 16 Posts: 333 Credit: 4,989,276,065 RAC: 18,484,343 Level Scientific publications | |
While I'm here, is there any way to force the project to update my hardware configuration? It thinks my host has two Quadro K620s instead of one of those and the Tesla. Its often said as the "Best" card but its just the 1st https://www.gpugrid.net/show_host_detail.php?hostid=475308 This host has a 1070 and 1080 but just shows 2x 1070s as the 1070 is in the 1st slot. Any way to check for a "best" would come up with the 1080. Or the 1070Ti that used to be there with the 1070. | |
| ID: 58281 | Rating: 0 | rate:
| |
|
Ian&Steve C. Send message Joined: 21 Feb 20 Posts: 1048 Credit: 40,228,383,983 RAC: 547,485 Level Scientific publications | |
In your case, the metrics that BOINC is looking at are identical between the two cards (actually all three of the 1070, 1070Ti, and 1080 have identical specs as far as BOINC ranking is concerned). All have the same amount of VRAM and have the same compute capability. So the tie goes to device number I guess. If you were to swap the 1080 for even a weaker card with a better CC (like a GTX 1650) then that would get picked up instead, even when not in the first slot. ____________ | |
| ID: 58282 | Rating: 0 | rate:
| |
|
SuperNanoCat Send message Joined: 3 Sep 21 Posts: 3 Credit: 51,773,232 RAC: 2,257,465 Level Scientific publications | |
|
Ah, I get it. I thought it was just stuck, because it did have two K620s before. I didn't realize BOINC was just incapable of acknowledging different cards from the same vendor. Does this affect project statistics? The Milkyway@home folks are gonna have real inflated opinions of the K620 next time they check the numbers haha | |
| ID: 58283 | Rating: 0 | rate:
| |
|
abouh Project administrator Project developer Project tester Project scientist Send message Joined: 31 May 21 Posts: 200 Credit: 0 RAC: 0 Level Scientific publications | |
|
Interesting I had seen this error once before locally, and I assumed it was due to a corrupted input file. | |
| ID: 58284 | Rating: 0 | rate:
| |
|
Keith Myers Send message Joined: 13 Dec 17 Posts: 1313 Credit: 6,016,967,459 RAC: 9,922,728 Level Scientific publications | |
|
This is the document I had found about fixing the BrokenProcessPool error. | |
| ID: 58285 | Rating: 0 | rate:
| |
|
klepel Send message Joined: 23 Dec 09 Posts: 189 Credit: 4,406,856,793 RAC: 2,291,327 Level Scientific publications | |
|
@abouh: Thank you for PM me twice! | |
| ID: 58286 | Rating: 0 | rate:
| |
|
ServicEnginIC Send message Joined: 24 Sep 10 Posts: 572 Credit: 7,515,397,024 RAC: 10,445,831 Level Scientific publications | |
Also I happened to catch two simultaneous Python tasks at my triple GTX 1650 GPU host. After upgrading system RAM from 32 GB to 64 GB at above mentioned host, it has successfully processed three concurrent ABOU Python GPU tasks: e2a43-ABOU_rnd_ppod_baseline_rnn-0-1-RND6933_3 - Link: https://www.gpugrid.net/result.php?resultid=32733458 e2a21-ABOU_rnd_ppod_baseline_rnn-0-1-RND3351_3 - Link: https://www.gpugrid.net/result.php?resultid=32733477 e2a27-ABOU_rnd_ppod_baseline_rnn-0-1-RND5112_1 - Link: https://www.gpugrid.net/result.php?resultid=32733441 More details at regarding Message #58287 | |
| ID: 58288 | Rating: 0 | rate:
| |
|
abouh Project administrator Project developer Project tester Project scientist Send message Joined: 31 May 21 Posts: 200 Credit: 0 RAC: 0 Level Scientific publications | |
|
Hello everyone, Traceback (most recent call last): It seems like the task is not allowed to create a new dirs inside its working directory. Just wondering if it could be some kind of configuration problem, just like the "INTERNAL ERROR: cannot create temporary directory!" for which a solution was already shared. ____________ | |
| ID: 58289 | Rating: 0 | rate:
| |
|
Richard Haselgrove Send message Joined: 11 Jul 09 Posts: 1589 Credit: 6,676,344,351 RAC: 9,081,515 Level Scientific publications | |
|
My question would be: what is the working directory? /home/boinc-client/slots/1/... but the final failure concerns /var/lib/boinc-client That sounds like a mixed-up installation of BOINC: 'home' sounds like a location for a user-mode installation of BOINC, but '/var/lib/' would be normal for a service mode installation. It's reasonable for the two different locations to have different write permissions. What app is doing the writing in each case, and what account are they running under? Could the final write location be hard-coded, but the others dependent on locations supplied by the local BOINC installation? | |
| ID: 58290 | Rating: 0 | rate:
| |
|
[VENETO] sabayonino Send message Joined: 4 Apr 10 Posts: 50 Credit: 645,641,596 RAC: 0 Level Scientific publications | |
|
Hi | |
| ID: 58291 | Rating: 0 | rate:
| |
|
abouh Project administrator Project developer Project tester Project scientist Send message Joined: 31 May 21 Posts: 200 Credit: 0 RAC: 0 Level Scientific publications | |
|
Right so the working directory is /home/boinc-client/slots/1/... to which the script has full access. The script tries to create a directory to save the logs, but I guess it should not do it in /var/lib/boinc-client So I think the problem is just that the package I am using to log results by default saves them outside the working directory. Should be easy to fix. ____________ | |
| ID: 58292 | Rating: 0 | rate:
| |
|
Richard Haselgrove Send message Joined: 11 Jul 09 Posts: 1589 Credit: 6,676,344,351 RAC: 9,081,515 Level Scientific publications | |
|
BOINC has the concept of a "data directory". Absolutely everything that has to be written should be written somewhere in that directory or its sub-directories. Everything else must be assumed to be sandboxed and inaccessible. | |
| ID: 58293 | Rating: 0 | rate:
| |
|
mmonnin Send message Joined: 2 Jul 16 Posts: 333 Credit: 4,989,276,065 RAC: 18,484,343 Level Scientific publications | |
The PC now as 1080 and 1080Ti with the Ti having more VRAM. BOINC shows 2x 1080. The 1080 is GPU 0 in nvidia-smi and so have the other BOINC displayed GPUs. The Ti is in the physical 1st slot. This PC happened to pick up two Python tasks. They aren't taking 4 days this time. 5:45 hr:min at 38.8% and 31 min at 11.8%. | |
| ID: 58294 | Rating: 0 | rate:
| |
|
Ian&Steve C. Send message Joined: 21 Feb 20 Posts: 1048 Credit: 40,228,383,983 RAC: 547,485 Level Scientific publications | |
what motherboard? and what version of BOINC?, your hosts are hidden so I cannot inspect myself. PCIe enumeration and ordering can be inconsistent against consumer boards. My server boards seem to enumerate starting from the slot furthest from the CPU socket, while most consumer boards are the opposite with device0 at the slot closest to the CPU socket. or do you perhaps run a locked coproc_info.xml file, this would prevent any GPU changes from being picked up by BOINC if it can't write to the coproc file. edit: also I forgot that most versions of BOINC incorrectly detect nvidia GPU memory. they will all max out at 4GB due to a bug in BOINC. So to BOINC your 1080Ti has the same amount of memory as your 1080. and since the 1080Ti is still a pascal card like the 1080, it has the same compute capability, so you're running into the same specs between them all still to get it to sort properly, you need to fix BOINC code, or use a GPU with higher or lower compute capability. put a Turing card in the system not in the first slot and BOINC will pick it up as GPU0 ____________ | |
| ID: 58295 | Rating: 0 | rate:
| |
|
Richard Haselgrove Send message Joined: 11 Jul 09 Posts: 1589 Credit: 6,676,344,351 RAC: 9,081,515 Level Scientific publications | |
|
The tests continue. Just reported e2a13-ABOU_rnd_ppod_baseline_cnn_nophi_2-0-1-RND9761_1, with final stats <result> <name>e2a13-ABOU_rnd_ppod_baseline_cnn_nophi_2-0-1-RND9761_1</name> <final_cpu_time>107668.100000</final_cpu_time> <final_elapsed_time>46186.399529</final_elapsed_time> That's an average CPU core count of 2.33 over the entire run - that's high for what is planned to be a GPU application. We can manage with that - I'm sure we all want to help develop and test the application for the coming research run - but I think it would be helpful to put more realistic usage values into the BOINC scheduler. | |
| ID: 58296 | Rating: 0 | rate:
| |
|
GDF Volunteer moderator Project administrator Project developer Project tester Volunteer developer Volunteer tester Project scientist Send message Joined: 14 Mar 07 Posts: 1957 Credit: 629,356 RAC: 0 Level Scientific publications | |
|
It's not a GPU application. It uses both CPU and GPU. | |
| ID: 58297 | Rating: 0 | rate:
| |
|
abouh Project administrator Project developer Project tester Project scientist Send message Joined: 31 May 21 Posts: 200 Credit: 0 RAC: 0 Level Scientific publications | |
|
Do you mean changing some of the BOINC parameters like it was done in the case of <rsc_fpops_est>? | |
| ID: 58298 | Rating: 0 | rate:
| |
|
Richard Haselgrove Send message Joined: 11 Jul 09 Posts: 1589 Credit: 6,676,344,351 RAC: 9,081,515 Level Scientific publications | |
|
It would need to be done in the plan class definition. Toni said that you define your plan classes in C++ code, so there are some examples in Specifying plan classes in C++. | |
| ID: 58299 | Rating: 0 | rate:
| |
|
FritzB Send message Joined: 7 Apr 15 Posts: 11 Credit: 2,374,441,100 RAC: 11,247,192 Level Scientific publications | |
|
it seems to work better now but I've reached time limit after 1800sec 19:39:23 (6124): task /usr/bin/flock reached time limit 1800 application ./gpugridpy/bin/python missing | |
| ID: 58300 | Rating: 0 | rate:
| |
|
Keith Myers Send message Joined: 13 Dec 17 Posts: 1313 Credit: 6,016,967,459 RAC: 9,922,728 Level Scientific publications | |
|
I'd like to hear what others are using for ncpus for their Python tasks in their app_config files. | |
| ID: 58301 | Rating: 0 | rate:
| |
|
Richard Haselgrove Send message Joined: 11 Jul 09 Posts: 1589 Credit: 6,676,344,351 RAC: 9,081,515 Level Scientific publications | |
|
I'm still running them at 1 CPU plus 1 GPU. They run fine, but when they are busy on the CPU-only sections, they steal time from the CPU tasks that are running at the same time - most obviously from CPDN. | |
| ID: 58302 | Rating: 0 | rate:
| |
|
Keith Myers Send message Joined: 13 Dec 17 Posts: 1313 Credit: 6,016,967,459 RAC: 9,922,728 Level Scientific publications | |
|
You could employ ProcessLasso on the apps and up their priority I suppose. | |
| ID: 58303 | Rating: 0 | rate:
| |
|
ServicEnginIC Send message Joined: 24 Sep 10 Posts: 572 Credit: 7,515,397,024 RAC: 10,445,831 Level Scientific publications | |
I'd like to hear what others are using for ncpus for their Python tasks in their app_config files. I think that Python GPU App is very efficient in adapting to any amount of CPU cores, and taking profit of available CPU resources. This seems to be in some way independent of ncpus parameter at Gpugrid app_config.xml Setup at my twin GPU system is as follows: <app> <name>PythonGPU</name> <gpu_versions> <gpu_usage>1.0</gpu_usage> <cpu_usage>0.49</cpu_usage> </gpu_versions> </app> And setup for my triple GPU system is as follows: <app> <name>PythonGPU</name> <gpu_versions> <gpu_usage>1.0</gpu_usage> <cpu_usage>0.33</cpu_usage> </gpu_versions> </app> The finality for this is being able to respectively run two or three concurrent Python GPU tasks without reaching a full "1" CPU core (2 x 0.49 = 0.98; 3 x 0.33 = 0.99). Then, I manually control CPU usage by setting "Use at most XX % of the CPUs" at BOINC Manager for each system, according to its amount of CPU cores. This allows me to run concurrently "N" Python GPU tasks and a fixed number of other CPU tasks as desired. But as said, Gpugrid Python GPU app seems to take CPU resources as needed for successfully processing its tasks... at the cost of slowing down the other CPU applications. | |
| ID: 58304 | Rating: 0 | rate:
| |
|
Richard Haselgrove Send message Joined: 11 Jul 09 Posts: 1589 Credit: 6,676,344,351 RAC: 9,081,515 Level Scientific publications | |
|
Yes, I use Process Lasso on all my Windows machines, but I haven't explored its use under Linux. | |
| ID: 58305 | Rating: 0 | rate:
| |
|
abouh Project administrator Project developer Project tester Project scientist Send message Joined: 31 May 21 Posts: 200 Credit: 0 RAC: 0 Level Scientific publications | |
|
This message 19:39:23 (6124): task /usr/bin/flock reached time limit 1800 Indicates that, after 30 minutes, the installation of miniconda and the task environment setup have not been finished. Consequently, python is not found later on to execute the task since it is one of the requirements of the miniconda environment. application ./gpugridpy/bin/python missing Therefore, it is not an error in itself, it just means that the miniconda setup went too slow for some reason (in theory 30 minutes should be enough time). Maybe the machine is slower than usual for some reason. Or the connection is slow and dependencies are not being downloaded. We could extend this timeout, but normally if 30 minutes is not enough for the miniconda setup another underlying problem could exists. ____________ | |
| ID: 58306 | Rating: 0 | rate:
| |
|
Ian&Steve C. Send message Joined: 21 Feb 20 Posts: 1048 Credit: 40,228,383,983 RAC: 547,485 Level Scientific publications | |
|
it seems to be a reasonably fast system. my guess is another type of permissions issue which is blocking the python install and it hits the timeout, or the CPUs are being too heavily used and not giving enough resources to the extraction process. | |
| ID: 58307 | Rating: 0 | rate:
| |
|
Keith Myers Send message Joined: 13 Dec 17 Posts: 1313 Credit: 6,016,967,459 RAC: 9,922,728 Level Scientific publications | |
|
There is no Linux equivalent of Process Lasso. | |
| ID: 58308 | Rating: 0 | rate:
| |
|
Richard Haselgrove Send message Joined: 11 Jul 09 Posts: 1589 Credit: 6,676,344,351 RAC: 9,081,515 Level Scientific publications | |
|
Well, that got me a long way. E: Unable to locate package python-qwt5-qt4 E: Unable to locate package python-configobj Unsurprisingly, the next step returns Traceback (most recent call last): File "./procexp.py", line 27, in <module> from PyQt5 import QtCore, QtGui, QtWidgets, uic ModuleNotFoundError: No module named 'PyQt5' htop, however, shows about 30 multitasking processes spawned from main, each using around 2% of a CPU core (varying by the second) at nice 19. At the time of inspection, that is. I'll go away and think about that. | |
| ID: 58309 | Rating: 0 | rate:
| |
|
Keith Myers Send message Joined: 13 Dec 17 Posts: 1313 Credit: 6,016,967,459 RAC: 9,922,728 Level Scientific publications | |
|
I've one task now that had the same timeout issue getting python. The host was running fine on these tasks before and I don't know what has changed. | |
| ID: 58310 | Rating: 0 | rate:
| |
|
Keith Myers Send message Joined: 13 Dec 17 Posts: 1313 Credit: 6,016,967,459 RAC: 9,922,728 Level Scientific publications | |
|
You might look into schedtool as an alternative. | |
| ID: 58311 | Rating: 0 | rate:
| |
|
Aurum Send message Joined: 12 Jul 17 Posts: 400 Credit: 13,821,664,882 RAC: 29,957,975 Level Scientific publications | |
I'd like to hear what others are using for ncpus for their Python tasks in their app_config files.Very interesting. Does this actually limit PythonGPU to using at most 5 cpu threads? Does it work better than: <app_config> <!-- i9-7980XE 18c36t 32 GB L3 Cache 24.75 MB --> <app> <name>PythonGPU</name> <plan_class>cuda1121</plan_class> <gpu_versions> <cpu_usage>1.0</cpu_usage> <gpu_usage>1.0</gpu_usage> </gpu_versions> <avg_ncpus>5</avg_ncpus> <cmdline>--nthreads 5</cmdline> <fraction_done_exact/> </app> </app_config> Edit 1: To answer my own question I changed cpu_usage to 5 and am running a single PythonGPU WU with nothing else going on. The System Monitor shows 5 CPUs are running in the 60 to 80% range with all othe CPU running in the 10 to 40% range. Is there any way to stop it from taking over ones entire computer? Edit 2: I turned on WCG and the group of 5 went up to 100% and all the rest went to OPN in the 80 to 95% range. | |
| ID: 58317 | Rating: 0 | rate:
| |
|
Ian&Steve C. Send message Joined: 21 Feb 20 Posts: 1048 Credit: 40,228,383,983 RAC: 547,485 Level Scientific publications | |
|
No. Setting that value won’t change how much CPU is actually used. It just tells BOINC how much of the CPU is being used so that it can probably account resources. | |
| ID: 58318 | Rating: 0 | rate:
| |
|
ServicEnginIC Send message Joined: 24 Sep 10 Posts: 572 Credit: 7,515,397,024 RAC: 10,445,831 Level Scientific publications | |
|
This morning, in a routine system update, I noticed that BOINC Client / Manager was updated from Version 7.16.17 to Version 7.18.1. | |
| ID: 58320 | Rating: 0 | rate:
| |
|
Richard Haselgrove Send message Joined: 11 Jul 09 Posts: 1589 Credit: 6,676,344,351 RAC: 9,081,515 Level Scientific publications | |
|
Which distro/repository are you using? I have Mint with Gianfranco Costamagna's PPA: that's usually the fastest to update, and I see v7.18.1 is being offered there as well - although I haven't installed it yet. | |
| ID: 58321 | Rating: 0 | rate:
| |
|
Jim1348 Send message Joined: 28 Jul 12 Posts: 819 Credit: 1,591,285,971 RAC: 0 Level Scientific publications | |
Which distro/repository are you using? I have Mint with Gianfranco Costamagna's PPA: that's usually the fastest to update, and I see v7.18.1 is being offered there as well - although I haven't installed it yet. It bombed out on the Rosetta pythons; they did not run at all (a VBox problem undoubtedly). And it failed all the validations on QuChemPedIA, which does not use VirtualBox on the Linux version. But it works OK on CPDN, WCG/ARP and Einstein/FGRBP (GPU). All were on Ubuntu 20.04.3. So be prepared to bail out if you have to. | |
| ID: 58322 | Rating: 0 | rate:
| |
|
ServicEnginIC Send message Joined: 24 Sep 10 Posts: 572 Credit: 7,515,397,024 RAC: 10,445,831 Level Scientific publications | |
Which distro/repository are you using? I'm using the regular repository for Ubuntu 20.04.3 LTS I took screenshot of offered updates before updating. | |
| ID: 58324 | Rating: 0 | rate:
| |
|
Richard Haselgrove Send message Joined: 11 Jul 09 Posts: 1589 Credit: 6,676,344,351 RAC: 9,081,515 Level Scientific publications | |
|
My PPA gives slightly more information on the available update: | |
| ID: 58325 | Rating: 0 | rate:
| |
|
Richard Haselgrove Send message Joined: 11 Jul 09 Posts: 1589 Credit: 6,676,344,351 RAC: 9,081,515 Level Scientific publications | |
|
OK, I've taken a deep breath and enough coffee - applied all updates. [Unit] Note the line I've picked out. That starts with a # sign, for comment, so it has no effect: PrivateTmp is undefined in this file. New work became available just as I was preparing to update, so I downloaded a task and immediately suspended it. After the updates, and enough reboots to get my NVidia drivers functional again (it took three this time), I restarted BOINC and allowed the task to run. Task 32736884 Our old enemy "INTERNAL ERROR: cannot create temporary directory!" is back. Time for a systemd over-ride file, and to go fishing for another task. Edit - updated the file, as described in message 58312, and got task 32736938. That seems to be running OK, having passed the 10% danger point. Result will be in sometime after midnight. | |
| ID: 58327 | Rating: 0 | rate:
| |
|
Keith Myers Send message Joined: 13 Dec 17 Posts: 1313 Credit: 6,016,967,459 RAC: 9,922,728 Level Scientific publications | |
|
I see your task completed normally with the PrivateTmp=true uncommented in the service file. | |
| ID: 58328 | Rating: 0 | rate:
| |
|
Richard Haselgrove Send message Joined: 11 Jul 09 Posts: 1589 Credit: 6,676,344,351 RAC: 9,081,515 Level Scientific publications | |
|
No, that's the first time I've seen that particular warning. The general structure is right for this machine, but it does't usually reach as high as 11 - GPUGrid normally gets slot 7. Whatever - there were some tasks left waiting after the updates and restarts. | |
| ID: 58329 | Rating: 0 | rate:
| |
|
abouh Project administrator Project developer Project tester Project scientist Send message Joined: 31 May 21 Posts: 200 Credit: 0 RAC: 0 Level Scientific publications | |
|
Oh, I was not aware of this warning. | |
| ID: 58330 | Rating: 0 | rate:
| |
|
abouh Project administrator Project developer Project tester Project scientist Send message Joined: 31 May 21 Posts: 200 Credit: 0 RAC: 0 Level Scientific publications | |
|
Yes, this experiments is with a slightly modified version of the algorithm, which should be faster. It runs the same number of interactions with the reinforcement learning environment, so the credits amount is the same. | |
| ID: 58331 | Rating: 0 | rate:
| |
|
Richard Haselgrove Send message Joined: 11 Jul 09 Posts: 1589 Credit: 6,676,344,351 RAC: 9,081,515 Level Scientific publications | |
|
I'll take a look at the contents of the slot directory, next time I see a task running. You're right - the entire '/var/lib/boinc-client/slots/n/...' structure should be writable, to any depth, by any program running under the boinc user account. | |
| ID: 58332 | Rating: 0 | rate:
| |
|
abouh Project administrator Project developer Project tester Project scientist Send message Joined: 31 May 21 Posts: 200 Credit: 0 RAC: 0 Level Scientific publications | |
|
The directory paths are defined as environment variables in the python script. # Set wandb paths Then the directories are created by the wandb python package (which handles logging of relevant training data). I suspect it could be in the creation that the permissions are defined. So it is not a BOINC problem. I will change the paths in future jobs to: # Set wandb paths Note that "os.getcwd()" is the working directory, so "/var/lib/boinc-client/slots/11/" in this case ____________ | |
| ID: 58333 | Rating: 0 | rate:
| |
|
Ian&Steve C. Send message Joined: 21 Feb 20 Posts: 1048 Credit: 40,228,383,983 RAC: 547,485 Level Scientific publications | |
Oh, I was not aware of this warning. what happens if that directory doesn't exist? several of us run BOINC in a different location. since it's in /var/lib/ the process wont have permissions to create the directory, unless maybe if BOINC is run as root. ____________ | |
| ID: 58334 | Rating: 0 | rate:
| |
|
Richard Haselgrove Send message Joined: 11 Jul 09 Posts: 1589 Credit: 6,676,344,351 RAC: 9,081,515 Level Scientific publications | |
|
'/var/lib/boinc-client/' is the default BOINC data directory for Ubuntu BOINC service (systemd) installations. It most certainly exists, and is writable, on my machine, which is where Keith first noticed the error message in the report of a successful run. During that run, much will have been written to .../slots/11 | |
| ID: 58335 | Rating: 0 | rate:
| |
|
Ian&Steve C. Send message Joined: 21 Feb 20 Posts: 1048 Credit: 40,228,383,983 RAC: 547,485 Level Scientific publications | |
|
I'm aware it's the default location on YOUR computer, and others running the standard ubuntu repository installer. but the message from abouh sounded like this directory was hard coded since he put the entire path. and for folks running BOINC in another location, this directory will not be the same. if it uses a relative file path, then it's fine, but I was seeking clarification. | |
| ID: 58336 | Rating: 0 | rate:
| |
|
Richard Haselgrove Send message Joined: 11 Jul 09 Posts: 1589 Credit: 6,676,344,351 RAC: 9,081,515 Level Scientific publications | |
|
Hard path coding was removed before this most recent test batch. | |
| ID: 58337 | Rating: 0 | rate:
| |
|
Jim1348 Send message Joined: 28 Jul 12 Posts: 819 Credit: 1,591,285,971 RAC: 0 Level Scientific publications | |
/var/lib/boinc-client/ does not exist on my system. /var/lib is write protected, creating a directory there requires elevated privileges, which I'm sure happens during install from the repository. Yes. I do the following dance whenever setting up BOINC from Ubuntu Software or LocutusOfBorg: Join the root group: sudo adduser (Username) root • Join the BOINC group: sudo adduser (Username) boinc • Allow access by all: sudo chmod -R 777 /etc/boinc-client • Allow access by all: sudo chmod -R 777 /var/lib/boinc-client I also do these to allow monitoring by BoincTasks over the LAN on my Win10 machine: • Copy “cc_config.xml” to /etc/boinc-client folder • Copy “gui_rpc_auth.cfg” to /etc/boinc-client folder • Reboot | |
| ID: 58338 | Rating: 0 | rate:
| |
|
abouh Project administrator Project developer Project tester Project scientist Send message Joined: 31 May 21 Posts: 200 Credit: 0 RAC: 0 Level Scientific publications | |
|
The directory should be created wherever you run BOINC, that is not a problem. | |
| ID: 58339 | Rating: 0 | rate:
| |
|
Retvari Zoltan Send message Joined: 20 Jan 09 Posts: 2343 Credit: 16,201,255,749 RAC: 0 Level Scientific publications | |
I do the following dance whenever setting up BOINC from Ubuntu Software or LocutusOfBorg:By doing so, you nullify your system's security provided by different access rights levels. This practice should be avoided by all costs. | |
| ID: 58340 | Rating: 0 | rate:
| |
|
Richard Haselgrove Send message Joined: 11 Jul 09 Posts: 1589 Credit: 6,676,344,351 RAC: 9,081,515 Level Scientific publications | |
|
I see that the BOINC PPA distribution has been updated yet again - still v7.18.1, but a new build timed at 17:10 yesterday, 4 February. | |
| ID: 58341 | Rating: 0 | rate:
| |
|
Jim1348 Send message Joined: 28 Jul 12 Posts: 819 Credit: 1,591,285,971 RAC: 0 Level Scientific publications | |
I do the following dance whenever setting up BOINC from Ubuntu Software or LocutusOfBorg:By doing so, you nullify your system's security provided by different access rights levels. I am on an isolated network behind a firewall/router. No problem at all. | |
| ID: 58342 | Rating: 0 | rate:
| |
|
Retvari Zoltan Send message Joined: 20 Jan 09 Posts: 2343 Credit: 16,201,255,749 RAC: 0 Level Scientific publications | |
I am on an isolated network behind a firewall/router. No problem at all.That qualifies as famous last words. | |
| ID: 58343 | Rating: 0 | rate:
| |
|
Jim1348 Send message Joined: 28 Jul 12 Posts: 819 Credit: 1,591,285,971 RAC: 0 Level Scientific publications | |
I see that the BOINC PPA distribution has been updated yet again - still v7.18.1, but a new build timed at 17:10 yesterday, 4 February. All I know is that the new build does not work at all on Cosmology with VirtualBox 6.1.32. A work unit just suspends immediately on startup. | |
| ID: 58344 | Rating: 0 | rate:
| |
|
Jim1348 Send message Joined: 28 Jul 12 Posts: 819 Credit: 1,591,285,971 RAC: 0 Level Scientific publications | |
I am on an isolated network behind a firewall/router. No problem at all.That qualifies as famous last words. It has lasted for many years. EDIT: They are all dedicated crunching machines. I have only BOINC and Folding on them. If they are a problem, I should pull out now. | |
| ID: 58345 | Rating: 0 | rate:
| |
|
Retvari Zoltan Send message Joined: 20 Jan 09 Posts: 2343 Credit: 16,201,255,749 RAC: 0 Level Scientific publications | |
I see that the BOINC PPA distribution has been updated yet again - still v7.18.1, but a new build timed at 17:10 yesterday, 4 February.My Ubuntu 20.04.3 machines updated themselves this morning to v7.18.1 for the 3rd time. (available version: 7.18.1+dfsg+202202041710~ubuntu20.04.1) | |
| ID: 58346 | Rating: 0 | rate:
| |
|
Retvari Zoltan Send message Joined: 20 Jan 09 Posts: 2343 Credit: 16,201,255,749 RAC: 0 Level Scientific publications | |
In your scenario, it's not a problem.I am on an isolated network behind a firewall/router. No problem at all.That qualifies as famous last words. It's dangerous to suggest that lazy solution to everyone, as their computers could be in a very different scenario. https://pimylifeup.com/chmod-777/ | |
| ID: 58347 | Rating: 0 | rate:
| |
|
Jim1348 Send message Joined: 28 Jul 12 Posts: 819 Credit: 1,591,285,971 RAC: 0 Level Scientific publications | |
In your scenario, it's not a problem.I am on an isolated network behind a firewall/router. No problem at all.That qualifies as famous last words. You might as well carry your warnings over to the Windows crowd, which doesn't have much security at all. | |
| ID: 58348 | Rating: 0 | rate:
| |
|
Retvari Zoltan Send message Joined: 20 Jan 09 Posts: 2343 Credit: 16,201,255,749 RAC: 0 Level Scientific publications | |
You might as well carry your warnings over to the Windows crowd, which doesn't have much security at all.Excuse me? | |
| ID: 58349 | Rating: 0 | rate:
| |
|
Jim1348 Send message Joined: 28 Jul 12 Posts: 819 Credit: 1,591,285,971 RAC: 0 Level Scientific publications | |
You might as well carry your warnings over to the Windows crowd, which doesn't have much security at all.Excuse me? What comparable isolation do you get in Windows from one program to another? Or what security are you talking about? Port security from external sources? | |
| ID: 58350 | Rating: 0 | rate:
| |
|
Retvari Zoltan Send message Joined: 20 Jan 09 Posts: 2343 Credit: 16,201,255,749 RAC: 0 Level Scientific publications | |
Security descriptors introduced into the NTFS 1.2 file system released in 1996 with Windows NT 4.0. The access control lists in NTFS are more complex in some aspects than in Linux. All modern Windows use NTFS by default.What comparable isolation do you get in Windows from one program to another?You might as well carry your warnings over to the Windows crowd, which doesn't have much security at all.Excuse me? User Account Control is introduced in 2007 with Windows Vista (=apps doesn't run as administrator even if the user has administrative privileges until the user elevates it through an annoying popup) Or what security are you talking about? Port security from external sources?Windows firewall is introced with Windows XP SP2 in 2004. This is my last post in this thread about (undermining) filesystem security. | |
| ID: 58351 | Rating: 0 | rate:
| |
|
Richard Haselgrove Send message Joined: 11 Jul 09 Posts: 1589 Credit: 6,676,344,351 RAC: 9,081,515 Level Scientific publications | |
I see that the BOINC PPA distribution has been updated yet again - still v7.18.1, but a new build timed at 17:10 yesterday, 4 February. Updated my second machine. It appears that this re-release is NOT releated to the systemd problem: the PrivateTmp=true line is still commented out. Re-apply the fix (#1) from message 58312 after applying this update, if you wish to continue running the Python test apps. | |
| ID: 58352 | Rating: 0 | rate:
| |
|
Jim1348 Send message Joined: 28 Jul 12 Posts: 819 Credit: 1,591,285,971 RAC: 0 Level Scientific publications | |
|
I think you are correct, except in the term "undermining", which is not appropriate for isolated crunching machines. There is a billion-dollar AV industry for Windows. Apparently someone has figured out how to undermine it there. But I agree that no more posts are necessary. | |
| ID: 58353 | Rating: 0 | rate:
| |
|
Ian&Steve C. Send message Joined: 21 Feb 20 Posts: 1048 Credit: 40,228,383,983 RAC: 547,485 Level Scientific publications | |
|
While chmod 777-ing in general is a bad practice. There’s little harm in blowing up the BOINC directory like that. Worst that can happen is you modify or delete a necessary file by accident and break BOINC. Just reinstall and learn the lesson. Not the end of the world in this instance. | |
| ID: 58354 | Rating: 0 | rate:
| |
|
Keith Myers Send message Joined: 13 Dec 17 Posts: 1313 Credit: 6,016,967,459 RAC: 9,922,728 Level Scientific publications | |
I see that the BOINC PPA distribution has been updated yet again - still v7.18.1, but a new build timed at 17:10 yesterday, 4 February. Ubuntu 20.04.3 LTS is still on the older 7.16.6 version. apt list boinc-client Listing... Done boinc-client/focal 7.16.6+dfsg-1 amd64 | |
| ID: 58355 | Rating: 0 | rate:
| |
|
Keith Myers Send message Joined: 13 Dec 17 Posts: 1313 Credit: 6,016,967,459 RAC: 9,922,728 Level Scientific publications | |
I see that the BOINC PPA distribution has been updated yet again - still v7.18.1, but a new build timed at 17:10 yesterday, 4 February.My Ubuntu 20.04.3 machines updated themselves this morning to v7.18.1 for the 3rd time. Curious how your Ubuntu release got this newer version. I did a sudo apt update and apt list boinc-client and apt show boinc-client and still come up with older 7.16.6 version. | |
| ID: 58356 | Rating: 0 | rate:
| |
|
Ian&Steve C. Send message Joined: 21 Feb 20 Posts: 1048 Credit: 40,228,383,983 RAC: 547,485 Level Scientific publications | |
|
I think they use a different PPA, not the standard Ubuntu version. | |
| ID: 58357 | Rating: 0 | rate:
| |
|
Retvari Zoltan Send message Joined: 20 Jan 09 Posts: 2343 Credit: 16,201,255,749 RAC: 0 Level Scientific publications | |
It's from http://ppa.launchpad.net/costamagnagianfranco/boinc/ubuntuMy Ubuntu 20.04.3 machines updated themselves this morning to v7.18.1 for the 3rd time. Sorry for the confusion. | |
| ID: 58358 | Rating: 0 | rate:
| |
|
ServicEnginIC Send message Joined: 24 Sep 10 Posts: 572 Credit: 7,515,397,024 RAC: 10,445,831 Level Scientific publications | |
I think they use a different PPA, not the standard Ubuntu version. You're right. I've checked, and this is my complete repository listing. There are new pending updates for BOINC package, but I've recently catched an ACEMD3 ADRIA new task, and I'm not updating until it be finished and reported. My experience warns that these tasks are highly prone to fail if something is changed while processing. | |
| ID: 58359 | Rating: 0 | rate:
| |
|
Richard Haselgrove Send message Joined: 11 Jul 09 Posts: 1589 Credit: 6,676,344,351 RAC: 9,081,515 Level Scientific publications | |
Which distro/repository are you using? Ah. Your reply here gave me a different impression. Slight egg on face, but both our Linux update manager screenshots fail to give source information in their consolidated update lists. Maybe we should put in a feature request? | |
| ID: 58360 | Rating: 0 | rate:
| |
|
Richard Haselgrove Send message Joined: 11 Jul 09 Posts: 1589 Credit: 6,676,344,351 RAC: 9,081,515 Level Scientific publications | |
|
ACEMD3 task finished on my original machine, so I updated BOINC from PPA 2022-01-30 to 2022-02-04. | |
| ID: 58361 | Rating: 0 | rate:
| |
|
Richard Haselgrove Send message Joined: 11 Jul 09 Posts: 1589 Credit: 6,676,344,351 RAC: 9,081,515 Level Scientific publications | |
|
Got a new task (task 32738148). Running normally, confirms override to systemd is preserved. wandb: WARNING Path /var/lib/boinc-client/slots/7/.config/wandb/wandb/ wasn't writable, using system temp directory (we're back in slot 7 as usual) There are six folders created in slot 7: agent_demos gpugridpy int_demos monitor_logs python_dependencies ROMS There are no hidden folders, and certainly no .config wandb data is in: /tmp/systemd-private-f670b90d460b4095a25c37b7348c6b93-boinc-client.service-7Jvpgh/tmp There are 138 folders in there, including one called simply wandb wandb contains: debug-internal.log debug.log latest-run run-20220206_163543-1wmmcgi5 The first two are files, the last two are folders. There is no subfolder called wandb - so no recursion, such as the warning message suggests. Hope that helps. | |
| ID: 58362 | Rating: 0 | rate:
| |
|
abouh Project administrator Project developer Project tester Project scientist Send message Joined: 31 May 21 Posts: 200 Credit: 0 RAC: 0 Level Scientific publications | |
|
Thanks! the content of the slot directory is correct. | |
| ID: 58363 | Rating: 0 | rate:
| |
|
Richard Haselgrove Send message Joined: 11 Jul 09 Posts: 1589 Credit: 6,676,344,351 RAC: 9,081,515 Level Scientific publications | |
|
wandb: Run data is saved locally in /var/lib/boinc-client/slots/7/wandb/run-20220209_082943-1pdoxrzo | |
| ID: 58364 | Rating: 0 | rate:
| |
|
abouh Project administrator Project developer Project tester Project scientist Send message Joined: 31 May 21 Posts: 200 Credit: 0 RAC: 0 Level Scientific publications | |
|
Great, thanks a lot for the confirmation. So now it seems the directory is appropriate one. | |
| ID: 58365 | Rating: 0 | rate:
| |
|
SuperNanoCat Send message Joined: 3 Sep 21 Posts: 3 Credit: 51,773,232 RAC: 2,257,465 Level Scientific publications | |
|
Pretty happy to see that my little Quadro K620s could actually handle one of the ABOU work units. Successfully ran one in under 31 hours. It didn't hit the memory too hard, which helps. The K620 has a DDR3 memory bus so the bandwidth is pretty limited. Traceback (most recent call last): File "run.py", line 40, in <module> assert os.path.exists('output.coor') AssertionError 11:22:33 (1966061): ./gpugridpy/bin/python exited; CPU time 0.295254 11:22:33 (1966061): app exit status: 0x1 11:22:33 (1966061): called boinc_finish(195) | |
| ID: 58367 | Rating: 0 | rate:
| |
|
[AF] fansyl Send message Joined: 26 Sep 13 Posts: 20 Credit: 1,714,356,441 RAC: 368 Level Scientific publications | |
|
All tasks goes in errors on this machine : https://www.gpugrid.net/results.php?hostid=591484 | |
| ID: 58368 | Rating: 0 | rate:
| |
|
Richard Haselgrove Send message Joined: 11 Jul 09 Posts: 1589 Credit: 6,676,344,351 RAC: 9,081,515 Level Scientific publications | |
|
I got two of those yesterday as well. They are described as "Anaconda Python 3 Environment v4.01 (mt)" - declared to run as multi-threaded CPU tasks. I do have working GPUs (on host 508381), but I don't think these tasks actually need a GPU. | |
| ID: 58369 | Rating: 0 | rate:
| |
|
Keith Myers Send message Joined: 13 Dec 17 Posts: 1313 Credit: 6,016,967,459 RAC: 9,922,728 Level Scientific publications | |
|
We were running those kind of tasks a year ago. Looks like the researcher has made an appearance again. | |
| ID: 58370 | Rating: 0 | rate:
| |
|
Jim1348 Send message Joined: 28 Jul 12 Posts: 819 Credit: 1,591,285,971 RAC: 0 Level Scientific publications | |
|
I just downloaded one, but it errored out before I could even catch it starting. It ran for 3 seconds, required four cores of a Ryzen 3950X on Ubuntu 20.04.3, and had an estimated time of 2 days. I think they have some work to do. | |
| ID: 58371 | Rating: 0 | rate:
| |
|
Jim1348 Send message Joined: 28 Jul 12 Posts: 819 Credit: 1,591,285,971 RAC: 0 Level Scientific publications | |
|
PPS - It ran for two minutes on an equivalent Ryzen 3950X running BOINC 7.16.6, and then errored out. | |
| ID: 58372 | Rating: 0 | rate:
| |
|
Drago Send message Joined: 3 May 20 Posts: 16 Credit: 405,444,060 RAC: 2,224,194 Level Scientific publications | |
|
I just ran 4 of the Python CPU tasks wu's on my Ryzen 7 5800H, Ubuntu 20.04.3 LTS, 16 GB ram. Each was run on 4 CPU threads at the same time. The first 0,6% took over 10 minutes, then they jumped to 10%, continued a while longer until 17 minutes were over and then erroed out all at more or less the same moment in the task. Here is one example: 32743954 | |
| ID: 58373 | Rating: 0 | rate:
| |
|
Richard Haselgrove Send message Joined: 11 Jul 09 Posts: 1589 Credit: 6,676,344,351 RAC: 9,081,515 Level Scientific publications | |
|
A RAIMIS MT task - which accounts for the 4 threads. Run NVIDIA GeForce RTX 3060 Laptop GPU (4095MB) Traceback (most recent call last): | |
| ID: 58374 | Rating: 0 | rate:
| |
|
Jim1348 Send message Joined: 28 Jul 12 Posts: 819 Credit: 1,591,285,971 RAC: 0 Level Scientific publications | |
|
I am running two of the Anacondas now. They each reserve four threads, but are apparently only using one of them, since BoincTasks shows 25% CPU usage. | |
| ID: 58380 | Rating: 0 | rate:
| |
|
Drago Send message Joined: 3 May 20 Posts: 16 Credit: 405,444,060 RAC: 2,224,194 Level Scientific publications | |
|
Hey Richard. In how far is my GPU's memory involved in a CPU task? | |
| ID: 58381 | Rating: 0 | rate:
| |
|
Richard Haselgrove Send message Joined: 11 Jul 09 Posts: 1589 Credit: 6,676,344,351 RAC: 9,081,515 Level Scientific publications | |
Hey Richard. In how far is my GPU's memory involved in a CPU task? It shouldn't be - that's why I drew attention to it. I think both AbouH and RAIMIS are experimenting with different applications, which exploit both GPUs and multiple CPUs. It isn't at all obvious how best to manage a combination like that under BOINC - the BOINC developers only got as far as thinking about either/or, not both together. So far, Abou seems to have got further down the road, but I'm not sure how much further development is required. We watch and wait, and help where we can. | |
| ID: 58382 | Rating: 0 | rate:
| |
|
Jim1348 Send message Joined: 28 Jul 12 Posts: 819 Credit: 1,591,285,971 RAC: 0 Level Scientific publications | |
|
My first two Anacondas ended OK after 31 hours. But they were _2 and _3. | |
| ID: 58383 | Rating: 0 | rate:
| |
|
Jim1348 Send message Joined: 28 Jul 12 Posts: 819 Credit: 1,591,285,971 RAC: 0 Level Scientific publications | |
I am running a _4 now. After 18 minutes it is OK, but the CPU usage is still trending down to a single core after starting out high. It stopped making progress after running for a day and reaching 26% complete, so I aborted it. I will wait until they fix things before jumping in again. But my results were different than the others, so maybe it will do them some good. | |
| ID: 58384 | Rating: 0 | rate:
| |
|
abouh Project administrator Project developer Project tester Project scientist Send message Joined: 31 May 21 Posts: 200 Credit: 0 RAC: 0 Level Scientific publications | |
|
Hello everyone! I am sorry for the late reply. | |
| ID: 58417 | Rating: 0 | rate:
| |
|
Richard Haselgrove Send message Joined: 11 Jul 09 Posts: 1589 Credit: 6,676,344,351 RAC: 9,081,515 Level Scientific publications | |
|
Is this a record? 08/03/2022 17:57:22 | GPUGRID | Started download of windows_x86_64__cuda1131.tar.bz2.e9a2e4346c92bfb71fae05c8321e9325 08/03/2022 18:35:03 | GPUGRID | Finished download of windows_x86_64__cuda1131.tar.bz2.e9a2e4346c92bfb71fae05c8321e9325 08/03/2022 18:35:26 | GPUGRID | Starting task e1a4-ABOU_pythonGPU_beta2_test-0-1-RND8371_5 08/03/2022 18:36:21 | GPUGRID | [sched_op] Reason: Unrecoverable error for task e1a4-ABOU_pythonGPU_beta2_test-0-1-RND8371_5 08/03/2022 18:36:21 | GPUGRID | Computation for task e1a4-ABOU_pythonGPU_beta2_test-0-1-RND8371_5 finished Edit 2 - "application C:\Windows\System32\tar.exe missing". I can deal with that. Download from https://sourceforge.net/projects/gnuwin32/files/tar/ NO - that wasn't what it said it was. Looking again. | |
| ID: 58464 | Rating: 0 | rate:
| |
|
Richard Haselgrove Send message Joined: 11 Jul 09 Posts: 1589 Credit: 6,676,344,351 RAC: 9,081,515 Level Scientific publications | |
|
No, this isn't working. Apparently, tar.exe is included in Windows 10 - but I'm still running Windows 7/64, and a copy from a W10 machine won't run ("Not a valid Win32 application"). Giving up for tonight - I've got too much waiting to juggle. I'll try again with a clearer head tomorrow. | |
| ID: 58465 | Rating: 0 | rate:
| |
|
mmonnin Send message Joined: 2 Jul 16 Posts: 333 Credit: 4,989,276,065 RAC: 18,484,343 Level Scientific publications | |
|
Yeah estimates must have astronomical as I am at over 2 months Time left at 3/4 completion on 2 tasks. | |
| ID: 58466 | Rating: 0 | rate:
| |
|
abouh Project administrator Project developer Project tester Project scientist Send message Joined: 31 May 21 Posts: 200 Credit: 0 RAC: 0 Level Scientific publications | |
|
No need to go back to the drawing board, in principle. Here is what is happening: | |
| ID: 58467 | Rating: 0 | rate:
| |
|
abouh Project administrator Project developer Project tester Project scientist Send message Joined: 31 May 21 Posts: 200 Credit: 0 RAC: 0 Level Scientific publications | |
|
In this new version of the app, we send the whole conda environment in a compressed file ONLY ONCE, and unpack it in the machine. The conda environment is what weights around 2.5 GB (depends on whether the machine has cuda10 or cuda11). However, while the environment remains the same there will be no need to re-download it in every job. This is how acemd app works. | |
| ID: 58468 | Rating: 0 | rate:
| |
|
abouh Project administrator Project developer Project tester Project scientist Send message Joined: 31 May 21 Posts: 200 Credit: 0 RAC: 0 Level Scientific publications | |
|
Some problems we are facing are, as Richard mentioned, that before W10 there is no tar.exe. tar.exe: Error opening archive: Can't initialize filter; unable to run program "bzip2 -d" In theory tar.exe is able to handle bzip2 files. We suspect it could be a problem with PATH env variable (which we will test). Also, tar gz could be a more compatible format for Windows. ____________ | |
| ID: 58469 | Rating: 0 | rate:
| |
|
Richard Haselgrove Send message Joined: 11 Jul 09 Posts: 1589 Credit: 6,676,344,351 RAC: 9,081,515 Level Scientific publications | |
|
Don't worry, it's only my own personal drawing board that I'm going back to! | |
| ID: 58470 | Rating: 0 | rate:
| |
|
abouh Project administrator Project developer Project tester Project scientist Send message Joined: 31 May 21 Posts: 200 Credit: 0 RAC: 0 Level Scientific publications | |
|
Thank you very much! I will send a small batch of test jobs as soon as I can to check if for windows 10 the bzip2 error is caused by an erroneous PATH variable. And the next step will be trying with tar.gz as mentioned. | |
| ID: 58471 | Rating: 0 | rate:
| |
|
mmonnin Send message Joined: 2 Jul 16 Posts: 333 Credit: 4,989,276,065 RAC: 18,484,343 Level Scientific publications | |
|
How about some checkpoints. I have a python task that was nearly completed, a ACEMD4 task downloaded next with like 8 billion days ETA. It interrupted the python task. 14hours of work and it went back to 10%. I only have 0.05 days work queue on that client so the python app was at least 95% complete. | |
| ID: 58472 | Rating: 0 | rate:
| |
|
abouh Project administrator Project developer Project tester Project scientist Send message Joined: 31 May 21 Posts: 200 Credit: 0 RAC: 0 Level Scientific publications | |
|
was it a PythonGPU task for Linux mmonnin? I have checked your recent jobs, seemed to be successful. | |
| ID: 58473 | Rating: 0 | rate:
| |
|
Richard Haselgrove Send message Joined: 11 Jul 09 Posts: 1589 Credit: 6,676,344,351 RAC: 9,081,515 Level Scientific publications | |
|
I have a python task for Linux running, recently started. CPU time 00:33:10 CPU time since checkpoint 00:01:33 Elapsed time 00:33:27 but that isn't the acid test: the question is whether it can read back the checkpoint data files when restarted. I'll pause it after a checkpoint, let the machine finish the last 20 minutes of the task it booted aside, and see what happens on restart. Sometimes BOINC takes a little while to update progress after a pause - you have to watch it, not just take the first figure you see. Results will be reported in task 32773760 overnight, but I'll post here before that. Edit - looks good so far: restart.chk, progress, run.log all present with a good timestamp. | |
| ID: 58474 | Rating: 0 | rate:
| |
|
abouh Project administrator Project developer Project tester Project scientist Send message Joined: 31 May 21 Posts: 200 Credit: 0 RAC: 0 Level Scientific publications | |
|
Perfect thanks! That it takes a little while to update progress after a pause, can happen. | |
| ID: 58475 | Rating: 0 | rate:
| |
|
Richard Haselgrove Send message Joined: 11 Jul 09 Posts: 1589 Credit: 6,676,344,351 RAC: 9,081,515 Level Scientific publications | |
However, Richard note that the result you linked is not PythonGPU but ACEMD 4. I am not sure how these do the checkpointing. Well, it was the only one I had in a suitable state for testing. And it's a good thing we checked. It appears that ACEMD4 in its current state (v1.03) does NOT handle checkpointing correctly. I suspended it manually at just after 10% complete: on restart, it wound back to 1% and started counting again from there. It's reached 2.980% as I type - four increments of 0.495. The run.log file (which we don't normally get a chance to see) has the ominous line # WARNING: removed an old file: output.xtc after a second set of startup details. Perhaps you could pass a message to the appropriate team? | |
| ID: 58476 | Rating: 0 | rate:
| |
|
abouh Project administrator Project developer Project tester Project scientist Send message Joined: 31 May 21 Posts: 200 Credit: 0 RAC: 0 Level Scientific publications | |
|
I will. Thanks a lot for the feedback. | |
| ID: 58477 | Rating: 0 | rate:
| |
|
mmonnin Send message Joined: 2 Jul 16 Posts: 333 Credit: 4,989,276,065 RAC: 18,484,343 Level Scientific publications | |
Perfect thanks! That it takes a little while to update progress after a pause, can happen. Yes it was linux. The % complete I saw was 100%, then a bit later 10% per BOINCTasks. Looking at the history on that PC it finished in 14:14 run time, just 11 minutes after the ACEMD4 tasks so it looks like it resumed properly. Thanks for checking. | |
| ID: 58478 | Rating: 0 | rate:
| |
|
Richard Haselgrove Send message Joined: 11 Jul 09 Posts: 1589 Credit: 6,676,344,351 RAC: 9,081,515 Level Scientific publications | |
|
OK, back on topic. Another of my Windows 7 machines has been allocated a genuine ABOU_pythonGPU_beta2 task (task 32779476), and I was able to suspend it before it even tried to run. I've been able to copy all the downloaded files into a sandbox to play with. <task> <application>C:\Windows\System32\tar.exe</application> <command_line>-xvf windows_x86_64__cuda1131.tar.gz</command_line> <setenv>PATH=C:\Windows\system32;C:\Windows</setenv> </task> You don't need both a path statement and a a hard-coded executable location. That may fail on a machine with non-standard drive assignments. It will certainly fail on this machine, because I still haven't been able to locate a viable tar.exe for Windows 7 (the Windows 10 executable won't run under Windows 7 - at least, I haven't found a way to make it run yet). I (and many other volunteers here) do have a freeware application called 7-Zip, and I've seen a suggestion that this may be able to handle the required decompression. I'll test that offline first, and if it works, I'll try to modify the job.xml file to use that instead. That's not a complete solution, of course, but it might give a pointer to the way forward. | |
| ID: 58479 | Rating: 0 | rate:
| |
|
Richard Haselgrove Send message Joined: 11 Jul 09 Posts: 1589 Credit: 6,676,344,351 RAC: 9,081,515 Level Scientific publications | |
|
OK, that works in principle. The 2.48 GB gz download decompresses to a single 4.91 GB tar file, and that in turn unpacks to 13,449 files in 632 folders. 7-Zip can handle both operations. | |
| ID: 58480 | Rating: 0 | rate:
| |
|
Richard Haselgrove Send message Joined: 11 Jul 09 Posts: 1589 Credit: 6,676,344,351 RAC: 9,081,515 Level Scientific publications | |
|
And it's worth a try. I'm going to split that task into two: <task> <application>"C:\Program Files\7-Zip\7z"</application> <command_line>x windows_x86_64__cuda1131.tar.gz</command_line> <setenv>PATH=C:\Windows\system32;C:\Windows</setenv> </task> <task> <application>"C:\Program Files\7-Zip\7z"</application> <command_line>x windows_x86_64__cuda1131.tar</command_line> <setenv>PATH=C:\Windows\system32;C:\Windows</setenv> </task> I could have piped them, but - baby steps! I'm going to need to increase the disk allowance: 10 (decimal) GB isn't enough. | |
| ID: 58481 | Rating: 0 | rate:
| |
|
mmonnin Send message Joined: 2 Jul 16 Posts: 333 Credit: 4,989,276,065 RAC: 18,484,343 Level Scientific publications | |
|
I had a W10 PC without tar.exe. I noticed the error in a task and copied the exe to system32 folder. | |
| ID: 58483 | Rating: 0 | rate:
| |
|
Richard Haselgrove Send message Joined: 11 Jul 09 Posts: 1589 Credit: 6,676,344,351 RAC: 9,081,515 Level Scientific publications | |
|
Damn. Where did that go wrong? application C:\Windows\System32\tar.exe missing Anyone else who wants to try this experiment can try https://www.7-zip.org/ - looks as if the license would even allow the project to distribute it. Edit - I edited the job.xml file while the previous task was finishing, and then stopped BOINC to increase the disk limit. On restart, BOINC must have noticed that the file had changed, and it downloaded a fresh copy. Near miss. | |
| ID: 58484 | Rating: 0 | rate:
| |
|
Richard Haselgrove Send message Joined: 11 Jul 09 Posts: 1589 Credit: 6,676,344,351 RAC: 9,081,515 Level Scientific publications | |
|
application "C:\Program Files\7-Zip\7z" missing Make that "C:\Program Files\7-Zip\7z.exe" Or maybe not. application "C:\Program Files\7-Zip\7z.exe" missing Isn't the damn wrapper clever enough to remove the quotes I put in there to protect the space in "Program Files"? | |
| ID: 58485 | Rating: 0 | rate:
| |
|
abouh Project administrator Project developer Project tester Project scientist Send message Joined: 31 May 21 Posts: 200 Credit: 0 RAC: 0 Level Scientific publications | |
|
Using tar.exe in W10 and W11 seems to work now. | |
| ID: 58486 | Rating: 0 | rate:
| |
|
Richard Haselgrove Send message Joined: 11 Jul 09 Posts: 1589 Credit: 6,676,344,351 RAC: 9,081,515 Level Scientific publications | |
|
On this particular Windows 7 machine, I have: | |
| ID: 58487 | Rating: 0 | rate:
| |
|
Richard Haselgrove Send message Joined: 11 Jul 09 Posts: 1589 Credit: 6,676,344,351 RAC: 9,081,515 Level Scientific publications | |
|
Yay! That's what I wanted to see: 17:49:09 (21360): wrapper: running C:\Program Files\7-Zip\7z.exe (x windows_x86_64__cuda1131.tar.gz) 7-Zip [64] 15.14 : Copyright (c) 1999-2015 Igor Pavlov : 2015-12-31 Scanning the drive for archives: 1 file, 2666937516 bytes (2544 MiB) Extracting archive: windows_x86_64__cuda1131.tar.gz And I've got v1.04 in my sandbox... | |
| ID: 58488 | Rating: 0 | rate:
| |
|
Richard Haselgrove Send message Joined: 11 Jul 09 Posts: 1589 Credit: 6,676,344,351 RAC: 9,081,515 Level Scientific publications | |
|
But not much more than that. After half an hour, it's got as far as: Everything is Ok Files: 13722 Size: 5270733721 Compressed: 5281648640 18:02:00 (21360): C:\Program Files\7-Zip\7z.exe exited; CPU time 6.567642 18:02:00 (21360): wrapper: running python.exe (run.py) WARNING: The script shortuuid.exe is installed in 'D:\BOINCdata\slots\5\Scripts' which is not on PATH. Consider adding this directory to PATH or, if you prefer to suppress this warning, use --no-warn-script-location. WARNING: The script normalizer.exe is installed in 'D:\BOINCdata\slots\5\Scripts' which is not on PATH. Consider adding this directory to PATH or, if you prefer to suppress this warning, use --no-warn-script-location. WARNING: The scripts wandb.exe and wb.exe are installed in 'D:\BOINCdata\slots\5\Scripts' which is not on PATH. Consider adding this directory to PATH or, if you prefer to suppress this warning, use --no-warn-script-location. ERROR: After October 2020 you may experience errors when installing or updating packages. This is because pip will change the way that it resolves dependency conflicts. We recommend you use --use-feature=2020-resolver to test your packages with the new resolver before it becomes the default. pytest 0.0.0 requires atomicwrites>=1.0, which is not installed. pytest 0.0.0 requires attrs>=17.4.0, which is not installed. pytest 0.0.0 requires iniconfig, which is not installed. pytest 0.0.0 requires packaging, which is not installed. pytest 0.0.0 requires py>=1.8.2, which is not installed. pytest 0.0.0 requires toml, which is not installed. aiohttp 3.7.4.post0 requires attrs>=17.3.0, which is not installed. WARNING: The scripts pyrsa-decrypt.exe, pyrsa-encrypt.exe, pyrsa-keygen.exe, pyrsa-priv2pub.exe, pyrsa-sign.exe and pyrsa-verify.exe are installed in 'D:\BOINCdata\slots\5\Scripts' which is not on PATH. Consider adding this directory to PATH or, if you prefer to suppress this warning, use --no-warn-script-location. WARNING: The script jsonschema.exe is installed in 'D:\BOINCdata\slots\5\Scripts' which is not on PATH. Consider adding this directory to PATH or, if you prefer to suppress this warning, use --no-warn-script-location. WARNING: The script gpustat.exe is installed in 'D:\BOINCdata\slots\5\Scripts' which is not on PATH. Consider adding this directory to PATH or, if you prefer to suppress this warning, use --no-warn-script-location. WARNING: The scripts ray-operator.exe, ray.exe, rllib.exe, serve.exe and tune.exe are installed in 'D:\BOINCdata\slots\5\Scripts' which is not on PATH. Consider adding this directory to PATH or, if you prefer to suppress this warning, use --no-warn-script-location. ERROR: After October 2020 you may experience errors when installing or updating packages. This is because pip will change the way that it resolves dependency conflicts. We recommend you use --use-feature=2020-resolver to test your packages with the new resolver before it becomes the default. pytest 0.0.0 requires atomicwrites>=1.0, which is not installed. pytest 0.0.0 requires iniconfig, which is not installed. pytest 0.0.0 requires py>=1.8.2, which is not installed. pytest 0.0.0 requires toml, which is not installed. WARNING: The script f2py.exe is installed in 'D:\BOINCdata\slots\5\Scripts' which is not on PATH. Consider adding this directory to PATH or, if you prefer to suppress this warning, use --no-warn-script-location. wandb: W&B API key is configured (use `wandb login --relogin` to force relogin) wandb: Appending key for api.wandb.ai to your netrc file: D:\BOINCdata\slots\5/.netrc wandb: Currently logged in as: rl-team-upf (use `wandb login --relogin` to force relogin) wandb: Tracking run with wandb version 0.12.11 wandb: Run data is saved locally in D:\BOINCdata\slots\5\wandb\run-20220310_181709-mxbeog6d wandb: Run `wandb offline` to turn off syncing. wandb: Syncing run MontezumaAgent_e1a12 wandb: View project at https://wandb.ai/rl-team-upf/MontezumaRevenge_rnd_ppo_cnn_nophi_baseline_beta wandb: View run at https://wandb.ai/rl-team-upf/MontezumaRevenge_rnd_ppo_cnn_nophi_baseline_beta/runs/mxbeog6d and doesn't seem to be getting any further. I'll see if it's moved on after dinner, might might abort it if it hasn't. Task is 32782603 | |
| ID: 58489 | Rating: 0 | rate:
| |
|
Richard Haselgrove Send message Joined: 11 Jul 09 Posts: 1589 Credit: 6,676,344,351 RAC: 9,081,515 Level Scientific publications | |
|
Then, lots of iterations of: OSError: [WinError 1455] The paging file is too small for this operation to complete. Error loading "D:\BOINCdata\slots\5\lib\site-packages\torch\lib\cudnn_cnn_train64_8.dll" or one of its dependencies. Traceback (most recent call last): File "<string>", line 1, in <module> File "D:\BOINCdata\slots\5\lib\multiprocessing\spawn.py", line 105, in spawn_main exitcode = _main(fd) File "D:\BOINCdata\slots\5\lib\multiprocessing\spawn.py", line 114, in _main prepare(preparation_data) File "D:\BOINCdata\slots\5\lib\multiprocessing\spawn.py", line 225, in prepare _fixup_main_from_path(data['init_main_from_path']) File "D:\BOINCdata\slots\5\lib\multiprocessing\spawn.py", line 277, in _fixup_main_from_path run_name="__mp_main__") File "D:\BOINCdata\slots\5\lib\runpy.py", line 263, in run_path pkg_name=pkg_name, script_name=fname) File "D:\BOINCdata\slots\5\lib\runpy.py", line 96, in _run_module_code mod_name, mod_spec, pkg_name, script_name) File "D:\BOINCdata\slots\5\lib\runpy.py", line 85, in _run_code exec(code, run_globals) File "D:\BOINCdata\slots\5\run.py", line 23, in <module> import torch File "D:\BOINCdata\slots\5\lib\site-packages\torch\__init__.py", line 126, in <module> raise err I've increased it ten-fold, but that requires a reboot - and the task didn't survive. Trying one last time, then it's 'No new Tasks' for tonight. | |
| ID: 58490 | Rating: 0 | rate:
| |
|
Richard Haselgrove Send message Joined: 11 Jul 09 Posts: 1589 Credit: 6,676,344,351 RAC: 9,081,515 Level Scientific publications | |
|
BTW, yes - the wrapper really is that dumb. | |
| ID: 58491 | Rating: 0 | rate:
| |
|
Bedrich Hajek Send message Joined: 28 Mar 09 Posts: 477 Credit: 9,337,172,716 RAC: 10,849,756 Level Scientific publications | |
|
I managed to complete 2 of these WUs successfully. They still need a lot of work done. You have low GPU usage, and they cause the boinc manager to be slow and sluggish and unresponsive. | |
| ID: 58492 | Rating: 0 | rate:
| |
|
mmonnin Send message Joined: 2 Jul 16 Posts: 333 Credit: 4,989,276,065 RAC: 18,484,343 Level Scientific publications | |
I had a W10 PC without tar.exe. I noticed the error in a task and copied the exe to system32 folder. Disabling python beta on this W10 PC has another 11+ hours gone https://www.gpugrid.net/result.php?resultid=32780319 | |
| ID: 58493 | Rating: 0 | rate:
| |
|
abouh Project administrator Project developer Project tester Project scientist Send message Joined: 31 May 21 Posts: 200 Credit: 0 RAC: 0 Level Scientific publications | |
|
Yes, I have seen this error in some other machines that could unpack the file with tar.exe. In just a few of them. So it is an issue in the python script. Today I will be looking into it. It does not happen in linux with the same code. | |
| ID: 58494 | Rating: 0 | rate:
| |
|
abouh Project administrator Project developer Project tester Project scientist Send message Joined: 31 May 21 Posts: 200 Credit: 0 RAC: 0 Level Scientific publications | |
|
Yes, regarding the workload, I have been testing the tasks with low GPU/CPU usage. I was interested in checking if the conda environment was successfully unpacked and the python script was able to complete a few iterations. It will be increased as soon as this part works, as well as the points. | |
| ID: 58495 | Rating: 0 | rate:
| |
|
abouh Project administrator Project developer Project tester Project scientist Send message Joined: 31 May 21 Posts: 200 Credit: 0 RAC: 0 Level Scientific publications | |
|
Could the astronomical time estimations be simply due to a wrong configuration of the rsc_fpops_est parameter? | |
| ID: 58496 | Rating: 0 | rate:
| |
|
Richard Haselgrove Send message Joined: 11 Jul 09 Posts: 1589 Credit: 6,676,344,351 RAC: 9,081,515 Level Scientific publications | |
Yes, I have seen this error in some other machines that could unpack the file with tar.exe. In just a few of them. So it is an issue in the python script. Today I will be looking into it. It does not happen in linux with the same code. I was a bit suspicious about the 'paging file too small' error - I didn't even think Windows applications could get information about what the current setting was. I'd suggest correlating the machines with this error, with their reported physical memory. Mine is 'only' 8 GB - small by modern standards. It looks like there may be some useful clues in https://discuss.pytorch.org/t/winerror-1455-the-paging-file-is-too-small-for-this-operation-to-complete/131233 | |
| ID: 58497 | Rating: 0 | rate:
| |
|
Richard Haselgrove Send message Joined: 11 Jul 09 Posts: 1589 Credit: 6,676,344,351 RAC: 9,081,515 Level Scientific publications | |
Could the astronomical time estimations be simply due to a wrong configuration of the rsc_fpops_est parameter? That's certainly a part of it, but it's a very long, complicated, and historical story. It will affect any and all platforms, not just Windows, and other data as well as rsc_fpops_est. And it's also related to historical decisions by both BOINC and GPUGrid. I'll try and write up some bedtime reading for you, but don't waste time on it in the meantime - there won't be an easy 'magic bullet' to fix it. | |
| ID: 58498 | Rating: 0 | rate:
| |
|
abouh Project administrator Project developer Project tester Project scientist Send message Joined: 31 May 21 Posts: 200 Credit: 0 RAC: 0 Level Scientific publications | |
|
Yes I was looking at the same link. Seems related to limited memory. I might try to run the suggested script before running the job, which seems to mitigate the problem. | |
| ID: 58499 | Rating: 0 | rate:
| |
|
Richard Haselgrove Send message Joined: 11 Jul 09 Posts: 1589 Credit: 6,676,344,351 RAC: 9,081,515 Level Scientific publications | |
|
Runtime estimation – and where it goes wrong | |
| ID: 58500 | Rating: 0 | rate:
| |
|
abouh Project administrator Project developer Project tester Project scientist Send message Joined: 31 May 21 Posts: 200 Credit: 0 RAC: 0 Level Scientific publications | |
|
Thank you very much for the explanation Richard, very helpful actually. | |
| ID: 58501 | Rating: 0 | rate:
| |
|
Retvari Zoltan Send message Joined: 20 Jan 09 Posts: 2343 Credit: 16,201,255,749 RAC: 0 Level Scientific publications | |
Maybe a temporary solution for the time estimation would be to set rsc_fpops_est for the PythonGPUbeta app to the same value we have in the PythonGPU app?This approach is wrong. The rsc_fpops_est should be set accprdingly for the actual batch of workunits, not for the app. As test batches are much shorter than production batches, they should have a much less rsc_fpops_est value, regardless that the same app processes them. | |
| ID: 58502 | Rating: 0 | rate:
| |
|
Richard Haselgrove Send message Joined: 11 Jul 09 Posts: 1589 Credit: 6,676,344,351 RAC: 9,081,515 Level Scientific publications | |
Maybe a temporary solution for the time estimation would be to set rsc_fpops_est for the PythonGPUbeta app to the same value we have in the PythonGPU app?This approach is wrong. Correct. Next time I see a really gross (multi-year) runtime estimate, I'll dig out the exact figures, show you the working-out, and try to analyse where they've come from. In the meantime, we're working through a glut of ACEMD3 tasks, and here's how they arrive: 12/03/2022 08:23:29 | GPUGRID | [sched_op] NVIDIA GPU work request: 11906.64 seconds; 0.00 devices So, I'm asking for a few hours of work, and getting several days. Or so BOINC says. This is Windows host 45218, which is currently showing "Task duration correction factor 13.714405". (It was higher a few minutes ago, when that work was fetched - over 13.84) I forgot to mention yesterday that in the first phase of BOINC's life, both your server and our clients took account of DCF, so the 'request' and 'estimated' figures would have been much closer. But when the APR code was added in 2010, the DCF code was removed from the servers. So your server knows what my DCF is, but it doesn't use that information. So the server probably assessed that each task would last about 11,055 seconds. That's why it added the second task to the allocation: it thought the first one didn't quite fill my request for 11,906 seconds. In reality, this is a short-running batch - although not marked as such - and the last one finished in 4,289 seconds. That's why DCF is falling after every task, though slowly. | |
| ID: 58505 | Rating: 0 | rate:
| |
|
mmonnin Send message Joined: 2 Jul 16 Posts: 333 Credit: 4,989,276,065 RAC: 18,484,343 Level Scientific publications | |
Yes, I have seen this error in some other machines that could unpack the file with tar.exe. In just a few of them. So it is an issue in the python script. Today I will be looking into it. It does not happen in linux with the same code. Having tar.exe wasn't enough. I later saw a popup in W10 saying archieveint.dll was missing. I had two python tasks in linux error out in ~30min with 15:33:14 (26820): task /usr/bin/flock reached time limit 1800 application ./gpugridpy/bin/python missing That PC has python 2.7.17 and 3.6.8 installed. | |
| ID: 58506 | Rating: 0 | rate:
| |
|
Richard Haselgrove Send message Joined: 11 Jul 09 Posts: 1589 Credit: 6,676,344,351 RAC: 9,081,515 Level Scientific publications | |
Next time I see a really gross (multi-year) runtime estimate, I'll dig out the exact figures, show you the working-out, and try to analyse where they've come from. Caught one! Task e1a5-ABOU_pythonGPU_beta2_test16-0-1-RND7314_1 Host is 43404. Windows 7. It has two GPUs, and GPUGrid is set to run on the other one, not as shown. The important bits are CUDA: NVIDIA GPU 0: NVIDIA GeForce GTX 1660 Ti (driver version 472.12, CUDA version 11.4, compute capability 7.5, 4096MB, 3032MB available, 5622 GFLOPS peak) DCF is 8.882342, and the task shows up as:  Why? This is what I got from the server, in the sched_reply file: <app_version> <app_name>PythonGPUbeta</app_name> <version_num>104</version_num> ... <flops>47361236228.648697</flops> ... <workunit> <rsc_fpops_est>1000000000000000000.000000</rsc_fpops_est> ... 1,000,000,000,000,000,000 fpops, at 47 GFLOPS, would take 21,114,313 seconds, or 244 days. Multiply in the DCF, and you get the 2170 days shown. According to the application details page, this host has completed one 'Python apps for GPU hosts beta 1.04 windows_x86_64 (cuda1131)' task (new apps always go right down to the bottom of that page). It recorded an APR of 1279539, which is bonkers the other way - these are GFlops, remember. It must have been task 32782603, which completed in 781 seconds. So, lessons to be learned: 1) A shortened test task, described as running for the full-run number of fpops, will register an astronomical speed. If anyone completes 11 tasks like that, that speed will get locked into the system for that host, and will cause the 'runtime limit exceeded' error. 2) BOINC is extremely bad - stupidly bad - at generating a first guess for the speed of a 'new application, new host' combination. It's actually taken precisely one-tenth of the speed of the acemd3 application on this machine, which might be taken as a "safe working assumption" for the time being. I'll try to check that in the server code. Oooh - I've let it run, and BOINC has remembered how I set up 7-Zip decompression last week. That's nice. | |
| ID: 58508 | Rating: 0 | rate:
| |
|
Richard Haselgrove Send message Joined: 11 Jul 09 Posts: 1589 Credit: 6,676,344,351 RAC: 9,081,515 Level Scientific publications | |
|
But it hasn't remembered the increased disk limit. Never mind - nor did I. | |
| ID: 58509 | Rating: 0 | rate:
| |
|
abouh Project administrator Project developer Project tester Project scientist Send message Joined: 31 May 21 Posts: 200 Credit: 0 RAC: 0 Level Scientific publications | |
|
Right now, the way PythonGPU app works is by dividing the job in 2 subtasks: 15:33:14 (26820): task /usr/bin/flock reached time limit 1800 means that after 1800 seconds, the conda environment was not yet created for some reason. This could be because the conda dependencies could not be downloaded in time or because the machine was running the installation process more slowly than expected. We set this time limit of 30 mins because in theory it is plenty of time to create the environment. However, in the new version (the current PythonGPUBeta), we send the whole conda environment compressed and simply unpack it in the machine. Therefor this error, which indeed happens every now and then now, should disappear. ____________ | |
| ID: 58510 | Rating: 0 | rate:
| |
|
abouh Project administrator Project developer Project tester Project scientist Send message Joined: 31 May 21 Posts: 200 Credit: 0 RAC: 0 Level Scientific publications | |
|
ok, so my plan was to run at least a few more batches of test jobs. Then start the real tasks. | |
| ID: 58511 | Rating: 0 | rate:
| |
|
Richard Haselgrove Send message Joined: 11 Jul 09 Posts: 1589 Credit: 6,676,344,351 RAC: 9,081,515 Level Scientific publications | |
|
My gut feeling is that it would be better to deploy the finished app (after all testing seems to be complete) as a new app_version. We would have to go through the training process for APR one last time, but then it should settle down. <flops>707593666701.291382</flops> <flops>70759366670.129135</flops> That must be deliberate. | |
| ID: 58512 | Rating: 0 | rate:
| |
|
Retvari Zoltan Send message Joined: 20 Jan 09 Posts: 2343 Credit: 16,201,255,749 RAC: 0 Level Scientific publications | |
Would it be better to create a new app for real jobs once the testing is finished?Based on the last few days' discussion here, I've understood the purpose of the former short and long queue from GPUGrid's perspective: By separating the tasks into two queues based on their length, the project's staff didn't have to bother setting the rsc_fpops_est value for each and every batch, (note that the same app was assigned to each queue). The two queues had used different (but constant through batches) rsc_fpops_est values, so the runtime estimation of BOINC could not get so much off in each queue that would tigger the "won't finish on time" or the "run time exceeded" situation. Perhaps this practise should be put in operation again, even on a finer level of granularity (S, M, L tasks, or even XS and XL tasks). | |
| ID: 58513 | Rating: 0 | rate:
| |
|
Bedrich Hajek Send message Joined: 28 Mar 09 Posts: 477 Credit: 9,337,172,716 RAC: 10,849,756 Level Scientific publications | |
|
I am getting "Disk usage limit exceeded" error. | |
| ID: 58518 | Rating: 0 | rate:
| |
|
abouh Project administrator Project developer Project tester Project scientist Send message Joined: 31 May 21 Posts: 200 Credit: 0 RAC: 0 Level Scientific publications | |
|
I believe the "Disk usage limit exceeded" error is not related to the machine resources, is defined by an adjustable parameter of the app. The conda environment + all the other files might be over this limit.I will review the current value, we might have to increase it. Thanks for pointing it out! | |
| ID: 58519 | Rating: 0 | rate:
| |
|
Richard Haselgrove Send message Joined: 11 Jul 09 Posts: 1589 Credit: 6,676,344,351 RAC: 9,081,515 Level Scientific publications | |
|
After a day out running a long acemd3 task, there's good news and bad news. <flops>336636264786015.625000</flops> <rsc_fpops_est>1000000000000000000.000000</rsc_fpops_est> That ends up with an estimated runtime of about 9 hours - but at the cost of a speed estimate of 336,636 GFlops. That's way beyond a marketing department's dream. Either somebody has done open-heart surgery on the project's database (unlikely and unwise), or BOINC now has enough completed tasks for v1.05 to start taking notice of the reported values. The bad news: I'm getting errors again. ModuleNotFoundError: No module named 'gym' | |
| ID: 58524 | Rating: 0 | rate:
| |
|
Richard Haselgrove Send message Joined: 11 Jul 09 Posts: 1589 Credit: 6,676,344,351 RAC: 9,081,515 Level Scientific publications | |
|
v1.06 is released and working (very short test tasks only). | |
| ID: 58527 | Rating: 0 | rate:
| |
|
abouh Project administrator Project developer Project tester Project scientist Send message Joined: 31 May 21 Posts: 200 Credit: 0 RAC: 0 Level Scientific publications | |
|
The latest version should fix this error. ModuleNotFoundError: No module named 'gym' ____________ | |
| ID: 58528 | Rating: 0 | rate:
| |
|
Richard Haselgrove Send message Joined: 11 Jul 09 Posts: 1589 Credit: 6,676,344,351 RAC: 9,081,515 Level Scientific publications | |
|
I have task 32836015 running - showing 50% after 30 minutes. That looks like it's giving the maths a good work-out. | |
| ID: 58529 | Rating: 0 | rate:
| |
|
abouh Project administrator Project developer Project tester Project scientist Send message Joined: 31 May 21 Posts: 200 Credit: 0 RAC: 0 Level Scientific publications | |
|
For now I am just trying to see the jobs finish.. I am not even trying to make them run for a long time. Jobs should not even need checkpoints, should last less than 15 mins. | |
| ID: 58534 | Rating: 0 | rate:
| |
|
Richard Haselgrove Send message Joined: 11 Jul 09 Posts: 1589 Credit: 6,676,344,351 RAC: 9,081,515 Level Scientific publications | |
|
Err, this particular task is running on Linux - specifically, Mint v20.3 | |
| ID: 58536 | Rating: 0 | rate:
| |
|
kksplace Send message Joined: 4 Mar 18 Posts: 53 Credit: 1,816,656,749 RAC: 6,127,494 Level Scientific publications | |
|
This task https://www.gpugrid.net/result.php?resultid=32841161 has been running for nearly 26 hours now. It is the first Python beta task I have received that appears to be working. Green-With-Envy shows intermittent low activity on my 1080 GPU and BoincTasks shows 100% CPU usage. It checkpointed only once several minutes after it started and has shown 50% complete ever since. | |
| ID: 58537 | Rating: 0 | rate:
| |
|
Richard Haselgrove Send message Joined: 11 Jul 09 Posts: 1589 Credit: 6,676,344,351 RAC: 9,081,515 Level Scientific publications | |
|
Sounds just like mine, including the 100% CPU usage - that'll be the wrapper app, rather than the main Python app. | |
| ID: 58538 | Rating: 0 | rate:
| |
|
kksplace Send message Joined: 4 Mar 18 Posts: 53 Credit: 1,816,656,749 RAC: 6,127,494 Level Scientific publications | |
|
Well, after a suspend and allowing it to run, it went back to its checkpoint and has shown no progress since. I will abort it. Keep on learning.... | |
| ID: 58539 | Rating: 0 | rate:
| |
|
abouh Project administrator Project developer Project tester Project scientist Send message Joined: 31 May 21 Posts: 200 Credit: 0 RAC: 0 Level Scientific publications | |
|
ok so it gets stuck at 50%. I will be reviewing it today. Thanks for the feedback. | |
| ID: 58540 | Rating: 0 | rate:
| |
|
Richard Haselgrove Send message Joined: 11 Jul 09 Posts: 1589 Credit: 6,676,344,351 RAC: 9,081,515 Level Scientific publications | |
|
Got a new one - the other Linux machine, but very similar. Looks like you've put some debug text into stderr.txt: 12:28:16 (482274): wrapper (7.7.26016): starting but nothing new has been added in the last five minutes. Showing 50% progress, no GPU activity. I'll give it another ten minutes or so, then try stop-start and abort if nothing new. Edit - no, no progress. Same result on two further tasks. All the quoted lines are written within about 5 seconds, then nothing. I'll let the machine do something else while I go shopping... Tasks for host 132158 | |
| ID: 58541 | Rating: 0 | rate:
| |
|
abouh Project administrator Project developer Project tester Project scientist Send message Joined: 31 May 21 Posts: 200 Credit: 0 RAC: 0 Level Scientific publications | |
|
Ok so I have seen 3 main errors in the last batches: | |
| ID: 58549 | Rating: 0 | rate:
| |
|
abouh Project administrator Project developer Project tester Project scientist Send message Joined: 31 May 21 Posts: 200 Credit: 0 RAC: 0 Level Scientific publications | |
|
We have updated to a new app version for windows that solves the following error: application C:\Windows\System32\tar.exe missing Now we send the 7z.exe (576 KB) file with the app, which allows to unpack the other files without relying on the host machine having tar.exe (which is only in windows 11 and latest builds of windows 10). I just sent a small batch of short tasks this morning to test and so far it seems to work. ____________ | |
| ID: 58550 | Rating: 0 | rate:
| |
|
Richard Haselgrove Send message Joined: 11 Jul 09 Posts: 1589 Credit: 6,676,344,351 RAC: 9,081,515 Level Scientific publications | |
|
Task 32868822 (Linux Mint GPU beta) | |
| ID: 58551 | Rating: 0 | rate:
| |
|
abouh Project administrator Project developer Project tester Project scientist Send message Joined: 31 May 21 Posts: 200 Credit: 0 RAC: 0 Level Scientific publications | |
|
Do you know by chance if this same machine works fine with PythonGPU tasks even if it fails in the PythonGPUBeta ones? | |
| ID: 58552 | Rating: 0 | rate:
| |
|
Richard Haselgrove Send message Joined: 11 Jul 09 Posts: 1589 Credit: 6,676,344,351 RAC: 9,081,515 Level Scientific publications | |
|
Yes, it does. Most recent was: | |
| ID: 58553 | Rating: 0 | rate:
| |
|
abouh Project administrator Project developer Project tester Project scientist Send message Joined: 31 May 21 Posts: 200 Credit: 0 RAC: 0 Level Scientific publications | |
|
I have also changed a bit the approach. | |
| ID: 58561 | Rating: 0 | rate:
| |
|
Richard Haselgrove Send message Joined: 11 Jul 09 Posts: 1589 Credit: 6,676,344,351 RAC: 9,081,515 Level Scientific publications | |
|
I've grabbed one. Will run within the hour. | |
| ID: 58562 | Rating: 0 | rate:
| |
|
abouh Project administrator Project developer Project tester Project scientist Send message Joined: 31 May 21 Posts: 200 Credit: 0 RAC: 0 Level Scientific publications | |
|
I sent 2 batches, | |
| ID: 58563 | Rating: 0 | rate:
| |
|
Richard Haselgrove Send message Joined: 11 Jul 09 Posts: 1589 Credit: 6,676,344,351 RAC: 9,081,515 Level Scientific publications | |
|
Yes, I got the testing2. It's been running for about 23 minutes now, but I'm seeing the same as yesterday - nothing written to stderr.txt since: 09:29:18 (51456): wrapper (7.7.26016): starting and machine usage shows  (full-screen version of that at https://i.imgur.com/Ly9Aabd.png) I've preserved the control information for that task, and I'll try to re-run it interactively in terminal later today - you can sometimes catch additional error messages that way. | |
| ID: 58564 | Rating: 0 | rate:
| |
|
abouh Project administrator Project developer Project tester Project scientist Send message Joined: 31 May 21 Posts: 200 Credit: 0 RAC: 0 Level Scientific publications | |
|
Ok thanks a lot. Maybe then it is not the python script but some of the dependencies. | |
| ID: 58565 | Rating: 0 | rate:
| |
|
Richard Haselgrove Send message Joined: 11 Jul 09 Posts: 1589 Credit: 6,676,344,351 RAC: 9,081,515 Level Scientific publications | |
|
OK, I've aborted that task to get my GPU back. I'll see what I can pick out of the preserved entrails, and let you know. | |
| ID: 58566 | Rating: 0 | rate:
| |
|
Richard Haselgrove Send message Joined: 11 Jul 09 Posts: 1589 Credit: 6,676,344,351 RAC: 9,081,515 Level Scientific publications | |
|
Sorry, ebcak. I copied all the files, but when I came to work on them, several turned out to be BOINC softlinks back to the project directory, where the original file had been deleted. So the fine detail had gone. | |
| ID: 58568 | Rating: 0 | rate:
| |
|
mmonnin Send message Joined: 2 Jul 16 Posts: 333 Credit: 4,989,276,065 RAC: 18,484,343 Level Scientific publications | |
|
The past several tasks have gotten stuck at 50% for me as well. Today one has made it past to 57.7% now in 8hours. 1-2% GPU util on 3070Ti. 2.5 CPU threads per BOINCTasks. 3063mb memory per nvidia-smi and 4.4GB per BOINCTasks. | |
| ID: 58569 | Rating: 0 | rate:
| |
|
abouh Project administrator Project developer Project tester Project scientist Send message Joined: 31 May 21 Posts: 200 Credit: 0 RAC: 0 Level Scientific publications | |
|
I updated the app. Tested it locally and works fine on Linux. | |
| ID: 58571 | Rating: 0 | rate:
| |
|
Richard Haselgrove Send message Joined: 11 Jul 09 Posts: 1589 Credit: 6,676,344,351 RAC: 9,081,515 Level Scientific publications | |
|
Got a couple on one of my Windows 7 machines. The first - task 32875836 - completed successfully, the second is running now. | |
| ID: 58572 | Rating: 0 | rate:
| |
|
abouh Project administrator Project developer Project tester Project scientist Send message Joined: 31 May 21 Posts: 200 Credit: 0 RAC: 0 Level Scientific publications | |
|
nice to hear it! lets see what happens on linux.. so weird if it only works in some machines and gets stuck in others... | |
| ID: 58573 | Rating: 0 | rate:
| |
|
Richard Haselgrove Send message Joined: 11 Jul 09 Posts: 1589 Credit: 6,676,344,351 RAC: 9,081,515 Level Scientific publications | |
nice to hear it! lets see what happens on linux.. so weird if it only works in some machines and gets stuck in others... Worse is to follow, I'm afraid. task 32875988 started immediately after the first one (same machine, but a different slot directory), but seems to have got stuck. I now seem to have two separate slot directories: Slot 0, where the original task ran. It has 31 items (3 folders, 28 files) at the top level, but the folder properties says the total (presumably expanding the site-packages) is 49 folders, 257 files, 3.62 GB Slot 5, allocated to the new task. It has 93 items at the top level (12 folders, including monitor_logs, and the rest files). This one looks the same as the first one did, while it was actively running the first task. This one has 14 files in the train directory - I think the first only had 4. This slot also has a stderr file, which ends with multiple repetitions of Traceback (most recent call last): File "<string>", line 1, in <module> File "D:\BOINCdata\slots\5\lib\multiprocessing\spawn.py", line 116, in spawn_main exitcode = _main(fd, parent_sentinel) File "D:\BOINCdata\slots\5\lib\multiprocessing\spawn.py", line 126, in _main self = reduction.pickle.load(from_parent) File "D:\BOINCdata\slots\5\lib\site-packages\pytorchrl\agent\env\__init__.py", line 1, in <module> from pytorchrl.agent.env.vec_env import VecEnv File "D:\BOINCdata\slots\5\lib\site-packages\pytorchrl\agent\env\vec_env.py", line 1, in <module> import torch File "D:\BOINCdata\slots\5\lib\site-packages\torch\__init__.py", line 126, in <module> raise err OSError: [WinError 1455] The paging file is too small for this operation to complete. Error loading "D:\BOINCdata\slots\5\lib\site-packages\torch\lib\shm.dll" or one of its dependencies. I'm going to try variations on a theme of - clear the old slot manually - pause and restart the task - stop and restart BOINC - stop and retsart Windows I'll report back what works and what doesn't. | |
| ID: 58574 | Rating: 0 | rate:
| |
|
Richard Haselgrove Send message Joined: 11 Jul 09 Posts: 1589 Credit: 6,676,344,351 RAC: 9,081,515 Level Scientific publications | |
|
Well, that was interesting. The files in slot 0 couldn't be deleted - they were locked by a running app 'python' - which is presumably why BOINC hadn't cleaned the folder when the first task finished. | |
| ID: 58575 | Rating: 0 | rate:
| |
|
STARBASEn Send message Joined: 17 Feb 09 Posts: 91 Credit: 1,603,303,394 RAC: 0 Level Scientific publications | |
|
Well this beta WU was a weird one: | |
| ID: 58576 | Rating: 0 | rate:
| |
|
abouh Project administrator Project developer Project tester Project scientist Send message Joined: 31 May 21 Posts: 200 Credit: 0 RAC: 0 Level Scientific publications | |
|
Interesting that sometimes jobs work and sometimes get stuck in the same machine. | |
| ID: 58577 | Rating: 0 | rate:
| |
|
Richard Haselgrove Send message Joined: 11 Jul 09 Posts: 1589 Credit: 6,676,344,351 RAC: 9,081,515 Level Scientific publications | |
|
I've just had task 32876361 fail on a different, but identical, Windows machine. This time, it seems to be explicitly, and simply, a "not enough memory" error - these machines only have 8 GB, which was fine when I bought them. I've suspended the beta programme for the time being, and I'll try to upgrade them. | |
| ID: 58578 | Rating: 0 | rate:
| |
|
Bedrich Hajek Send message Joined: 28 Mar 09 Posts: 477 Credit: 9,337,172,716 RAC: 10,849,756 Level Scientific publications | |
|
Another "Disk usage limit exceeded" error: | |
| ID: 58581 | Rating: 0 | rate:
| |
|
roundup Send message Joined: 11 May 10 Posts: 60 Credit: 2,901,505,193 RAC: 39,106,109 Level Scientific publications | |
|
After having some errors with recent python app betas, task 32876819 ran without error on a RTX3070 Mobile under Win 11. | |
| ID: 58582 | Rating: 0 | rate:
| |
|
captainjack Send message Joined: 9 May 13 Posts: 171 Credit: 2,592,346,788 RAC: 200,707 Level Scientific publications | |
|
These tasks seem to run much better on my machines if I allocate 6 CPU's (threads) to each task. I managed to run one by itself and watched the performance monitor for CPU usage. During the initiation phase (about 5 minutes), the task used ~6 CPU's (threads). After the initiation phase, the CPU usage was in an oscillating pattern that was between ~2 and ~5 threads. Task ran very quickly and has been validated. Please let me know if you have questions. | |
| ID: 58588 | Rating: 0 | rate:
| |
|
abouh Project administrator Project developer Project tester Project scientist Send message Joined: 31 May 21 Posts: 200 Credit: 0 RAC: 0 Level Scientific publications | |
|
Thanks a lot for the feedback: | |
| ID: 58590 | Rating: 0 | rate:
| |
|
abouh Project administrator Project developer Project tester Project scientist Send message Joined: 31 May 21 Posts: 200 Credit: 0 RAC: 0 Level Scientific publications | |
|
Last batches seem to be working successfully both in Linux and Windows, and also for GPUs with cuda 10 and cuda 11. | |
| ID: 58591 | Rating: 0 | rate:
| |
|
Richard Haselgrove Send message Joined: 11 Jul 09 Posts: 1589 Credit: 6,676,344,351 RAC: 9,081,515 Level Scientific publications | |
It was reported that the reason was that the Python was not finishing correctly between jobs so I added a few changes in the code to try to solve this issue. Well, that was one report of one task on one machine with limited memory. It seemed be a case that, if it happened, caused problems for the following task. It's certainly worth looking at, and if it prevents some tasks failing - great. But I'd be cautious about assuming that it was the problem in all cases. | |
| ID: 58592 | Rating: 0 | rate:
| |
|
STARBASEn Send message Joined: 17 Feb 09 Posts: 91 Credit: 1,603,303,394 RAC: 0 Level Scientific publications | |
I will see if I can add some code at the end of the task to make sure all python processes are killed and the main program exits correctly. And send another testing round. I haven't gotten a new beta yet so I will shut off all GPU work with other projects to hopefully get some and help resolve this issue. | |
| ID: 58593 | Rating: 0 | rate:
| |
|
STARBASEn Send message Joined: 17 Feb 09 Posts: 91 Credit: 1,603,303,394 RAC: 0 Level Scientific publications | |
|
One other after thought re that WU. I had checked my status page here prior to aborting the task. It indicated the task was still in progress so no disposition of the files that I am presuming were sent back sometime in the past (since the slot was empty) was assigned to it. Wonder where they went? | |
| ID: 58594 | Rating: 0 | rate:
| |
|
Short Final Send message Joined: 26 May 20 Posts: 4 Credit: 163,984,432 RAC: 24,294 Level Scientific publications | |
|
Can anybody explain credits policy please. | |
| ID: 58597 | Rating: 0 | rate:
| |
|
Richard Haselgrove Send message Joined: 11 Jul 09 Posts: 1589 Credit: 6,676,344,351 RAC: 9,081,515 Level Scientific publications | |
|
Please note that other users can't see your entire task list by userid - that's a privacy policy common to all BOINC projects. | |
| ID: 58598 | Rating: 0 | rate:
| |
|
Keith Myers Send message Joined: 13 Dec 17 Posts: 1313 Credit: 6,016,967,459 RAC: 9,922,728 Level Scientific publications | |
|
For some reason I haven't been able to snag any of the Python beta tasks lately. | |
| ID: 58599 | Rating: 0 | rate:
| |
|
abouh Project administrator Project developer Project tester Project scientist Send message Joined: 31 May 21 Posts: 200 Credit: 0 RAC: 0 Level Scientific publications | |
|
The credits system is proportional to the amount of compute required to complete each task, like in acemd3. | |
| ID: 58600 | Rating: 0 | rate:
| |
|
abouh Project administrator Project developer Project tester Project scientist Send message Joined: 31 May 21 Posts: 200 Credit: 0 RAC: 0 Level Scientific publications | |
|
Batches of both pythonGPU and pythonGPUBeta are being sent out this week. Hopefully pythonGPUBeta task will run without issues. | |
| ID: 58601 | Rating: 0 | rate:
| |
|
bcavnaugh Send message Joined: 8 Nov 13 Posts: 56 Credit: 1,002,640,163 RAC: 0 Level Scientific publications | |
|
So far some run well while other ran for 2 and 3 days. | |
| ID: 58602 | Rating: 0 | rate:
| |
|
Keith Myers Send message Joined: 13 Dec 17 Posts: 1313 Credit: 6,016,967,459 RAC: 9,922,728 Level Scientific publications | |
|
Looks like the standard BOINC mechanism of complain in a post on the forums on some topic and the BOINC genies grant your wish. | |
| ID: 58603 | Rating: 0 | rate:
| |
|
WR-HW95 Send message Joined: 16 Dec 08 Posts: 7 Credit: 1,426,626,313 RAC: 410 Level Scientific publications | |
|
I have serious problems with my other machine running 1080Ti. | |
| ID: 58604 | Rating: 0 | rate:
| |
|
Ian&Steve C. Send message Joined: 21 Feb 20 Posts: 1048 Credit: 40,228,383,983 RAC: 547,485 Level Scientific publications | |
I have serious problems with my other machine running 1080Ti. you can try changing the driver back and see? easy troubleshooting step. It's definitely possible to be the driver. but you seem to be having an issue with the ACEMD3 tasks, this thread is about the Python tasks. ____________ | |
| ID: 58605 | Rating: 0 | rate:
| |
|
WR-HW95 Send message Joined: 16 Dec 08 Posts: 7 Credit: 1,426,626,313 RAC: 410 Level Scientific publications | |
|
Sorry for posting wrong thread. | |
| ID: 58606 | Rating: 0 | rate:
| |
|
Ian&Steve C. Send message Joined: 21 Feb 20 Posts: 1048 Credit: 40,228,383,983 RAC: 547,485 Level Scientific publications | |
|
I've had no problems with their CUDA ACEMD3 app. it's been very stable across many data sets. all of the issues raised in this thread are in regards to the Python app that's still in testing/beta. problems are to be expected. | |
| ID: 58607 | Rating: 0 | rate:
| |
|
Erich56 Send message Joined: 1 Jan 15 Posts: 1105 Credit: 7,822,620,176 RAC: 1,815,365 Level Scientific publications | |
|
bcavnaugh wrote: ... For now I an waiting for new 3 & 4 on two of my hosts, it is a real bummer that our hosts have to sit for days on end without getting any tasks. you say it, indeed :-( Obviously, ACEMD has very low priority at GPUGRID these days :-( | |
| ID: 58608 | Rating: 0 | rate:
| |
|
Keith Myers Send message Joined: 13 Dec 17 Posts: 1313 Credit: 6,016,967,459 RAC: 9,922,728 Level Scientific publications | |
|
Beta is still having issues with establishing the correct Python environment. | |
| ID: 58609 | Rating: 0 | rate:
| |
|
abouh Project administrator Project developer Project tester Project scientist Send message Joined: 31 May 21 Posts: 200 Credit: 0 RAC: 0 Level Scientific publications | |
|
thanks, this is solved now. A new batch is running without this issue. | |
| ID: 58613 | Rating: 0 | rate:
| |
|
Richard Haselgrove Send message Joined: 11 Jul 09 Posts: 1589 Credit: 6,676,344,351 RAC: 9,081,515 Level Scientific publications | |
|
There are still a few old tasks around. I got the _9 (and hopefully final) issue of WU 27184379 from 19 March. It registered the 51% mark but hasn't moved on in over 3 hours: I'm afraid it's going the same way as all previous attempts. | |
| ID: 58614 | Rating: 0 | rate:
| |
|
Keith Myers Send message Joined: 13 Dec 17 Posts: 1313 Credit: 6,016,967,459 RAC: 9,922,728 Level Scientific publications | |
|
Yes, I am still getting the bad work unit resends. | |
| ID: 58615 | Rating: 0 | rate:
| |
|
Richard Haselgrove Send message Joined: 11 Jul 09 Posts: 1589 Credit: 6,676,344,351 RAC: 9,081,515 Level Scientific publications | |
|
New tasks today. | |
| ID: 58616 | Rating: 0 | rate:
| |
|
Keith Myers Send message Joined: 13 Dec 17 Posts: 1313 Credit: 6,016,967,459 RAC: 9,922,728 Level Scientific publications | |
|
Same here today. | |
| ID: 58617 | Rating: 0 | rate:
| |
|
Azmodes Send message Joined: 7 Jan 17 Posts: 34 Credit: 1,371,429,518 RAC: 0 Level Scientific publications | |
|
Same. | |
| ID: 58618 | Rating: 0 | rate:
| |
|
abouh Project administrator Project developer Project tester Project scientist Send message Joined: 31 May 21 Posts: 200 Credit: 0 RAC: 0 Level Scientific publications | |
|
Thanks for the feedback. I will look into it today. | |
| ID: 58619 | Rating: 0 | rate:
| |
|
Richard Haselgrove Send message Joined: 11 Jul 09 Posts: 1589 Credit: 6,676,344,351 RAC: 9,081,515 Level Scientific publications | |
In which OS? These were "Python apps for GPU hosts v4.01 (cuda1121)", which is Linux only. | |
| ID: 58621 | Rating: 0 | rate:
| |
|
abouh Project administrator Project developer Project tester Project scientist Send message Joined: 31 May 21 Posts: 200 Credit: 0 RAC: 0 Level Scientific publications | |
|
Right I just saw it browsing thought the failed jobs. It seems that is in the PythonGPU app not in PythonGPUBeta. | |
| ID: 58622 | Rating: 0 | rate:
| |
|
abouh Project administrator Project developer Project tester Project scientist Send message Joined: 31 May 21 Posts: 200 Credit: 0 RAC: 0 Level Scientific publications | |
|
The current version of PythonGPUBeta has been copied to PythonGPU | |
| ID: 58624 | Rating: 0 | rate:
| |
|
Greg _BE Send message Joined: 30 Jun 14 Posts: 127 Credit: 110,756,939 RAC: 4,306 Level Scientific publications | |
|
Well this is interesting to read. | |
| ID: 58625 | Rating: 0 | rate:
| |
|
abouh Project administrator Project developer Project tester Project scientist Send message Joined: 31 May 21 Posts: 200 Credit: 0 RAC: 0 Level Scientific publications | |
|
The size for all the app files (including the compressed environment) are: | |
| ID: 58634 | Rating: 0 | rate:
| |
|
abouh Project administrator Project developer Project tester Project scientist Send message Joined: 31 May 21 Posts: 200 Credit: 0 RAC: 0 Level Scientific publications | |
|
Also, the PythonGPU app version used in the new jobs should be 402 (or 4.02). | |
| ID: 58635 | Rating: 0 | rate:
| |
|
Richard Haselgrove Send message Joined: 11 Jul 09 Posts: 1589 Credit: 6,676,344,351 RAC: 9,081,515 Level Scientific publications | |
|
I have e1a46-ABOU_rnd_ppod_avoid_cnn_3-0-1-RND3588_4 running under Linux. I can confirm that my task (and its four predecessors) are running with the v4.02 app. | |
| ID: 58636 | Rating: 0 | rate:
| |
|
abouh Project administrator Project developer Project tester Project scientist Send message Joined: 31 May 21 Posts: 200 Credit: 0 RAC: 0 Level Scientific publications | |
|
Thanks a lot for the info Richard! | |
| ID: 58637 | Rating: 0 | rate:
| |
|
Richard Haselgrove Send message Joined: 11 Jul 09 Posts: 1589 Credit: 6,676,344,351 RAC: 9,081,515 Level Scientific publications | |
|
I'd say 1%::99%, but thanks. | |
| ID: 58638 | Rating: 0 | rate:
| |
|
Richard Haselgrove Send message Joined: 11 Jul 09 Posts: 1589 Credit: 6,676,344,351 RAC: 9,081,515 Level Scientific publications | |
|
Uploaded and reported with no problem at all. | |
| ID: 58639 | Rating: 0 | rate:
| |
|
abouh Project administrator Project developer Project tester Project scientist Send message Joined: 31 May 21 Posts: 200 Credit: 0 RAC: 0 Level Scientific publications | |
|
has the allowed limit changed to 30,000,000,000 bytes? | |
| ID: 58640 | Rating: 0 | rate:
| |
|
Keith Myers Send message Joined: 13 Dec 17 Posts: 1313 Credit: 6,016,967,459 RAC: 9,922,728 Level Scientific publications | |
|
Appears so. | |
| ID: 58641 | Rating: 0 | rate:
| |
|
Greg _BE Send message Joined: 30 Jun 14 Posts: 127 Credit: 110,756,939 RAC: 4,306 Level Scientific publications | |
The size for all the app files (including the compressed environment) are: Note: I was commenting on Rosetta at home CPU pythons. What yours do, I don't know. I guess i had better add your project and see what happens. I readded your project to my system, so if I am home when a task is sent out, I'll have a look. | |
| ID: 58642 | Rating: 0 | rate:
| |
|
abouh Project administrator Project developer Project tester Project scientist Send message Joined: 31 May 21 Posts: 200 Credit: 0 RAC: 0 Level Scientific publications | |
|
Thank you! | |
| ID: 58643 | Rating: 0 | rate:
| |
|
abouh Project administrator Project developer Project tester Project scientist Send message Joined: 31 May 21 Posts: 200 Credit: 0 RAC: 0 Level Scientific publications | |
|
Testing was successful, so we can add the weights to the PythonGPU app job.xml file | |
| ID: 58644 | Rating: 0 | rate:
| |
|
Greg _BE Send message Joined: 30 Jun 14 Posts: 127 Credit: 110,756,939 RAC: 4,306 Level Scientific publications | |
|
abouh, | |
| ID: 58655 | Rating: 0 | rate:
| |
|
mikey Send message Joined: 2 Jan 09 Posts: 292 Credit: 3,264,748,615 RAC: 9,164,619 Level Scientific publications | |
You can delete the previous post about ACMED3. I posted that incorrectly here. Some forums let you put a double space or a double period to delete your own post, but you must still do it within the editing time | |
| ID: 58666 | Rating: 0 | rate:
| |
|
Greg _BE Send message Joined: 30 Jun 14 Posts: 127 Credit: 110,756,939 RAC: 4,306 Level Scientific publications | |
|
Mikey, I know. But the time limit expired on that post to edit it. I came back days later not within the 30-60 minutes allowed. | |
| ID: 58669 | Rating: 0 | rate:
| |
|
Werinbert Send message Joined: 12 May 13 Posts: 5 Credit: 100,032,540 RAC: 0 Level Scientific publications | |
|
I am now running a Python task. It has a very low usage of my GPU most often around 5 to 10%, occasionally getting up to 20%. Is this normal? Should I wait until I move my GPU from an old 3770K to a 12500 computer for better CPU capabilities to do these tasks? | |
| ID: 58672 | Rating: 0 | rate:
| |
|
Keith Myers Send message Joined: 13 Dec 17 Posts: 1313 Credit: 6,016,967,459 RAC: 9,922,728 Level Scientific publications | |
|
This is normal for Python on GPU tasks. The tasks run on both the cpu and gpu during parts of the computation for the inferencing and machine learning segments. - cyclical GPU load is expected in Reinforcement Learning algorithms. Whenever GPU load in lower, CPU usage should increase. It is correct. | |
| ID: 58673 | Rating: 0 | rate:
| |
|
abouh Project administrator Project developer Project tester Project scientist Send message Joined: 31 May 21 Posts: 200 Credit: 0 RAC: 0 Level Scientific publications | |
|
Sorry for the late reply Greg _BE, I hid the ACEMD3 posts. | |
| ID: 58674 | Rating: 0 | rate:
| |
|
Richard Haselgrove Send message Joined: 11 Jul 09 Posts: 1589 Credit: 6,676,344,351 RAC: 9,081,515 Level Scientific publications | |
|
New tasks being issued this morning, allocated to the old Linux v4.01 'Python app for GPU hosts' issued in October 2021. | |
| ID: 58675 | Rating: 0 | rate:
| |
|
Richard Haselgrove Send message Joined: 11 Jul 09 Posts: 1589 Credit: 6,676,344,351 RAC: 9,081,515 Level Scientific publications | |
I am not sure, but maybe one problem is that we ask only for 0.987 CPUs, since that was ideal for ACEMD jobs. In reality Python tasks use more. I will look into it. Asking for 1.00 CPUs (or above) would make a significant difference, because that would prompt the BOINC client to reduce the number of tasks being run for other projects. It would be problematic to increase the CPU demand above 1.00, because the CPU loading is dynamic - BOINC has no provision for allowing another project to utilise the cycles available during periods when the GPUGrid app is quiescent. Normally, a GPU app is given a higher process priority for CPU usage than a pure CPU app, so the operating system should allocate resources to your advantage, but that can be problematic when the wrapper app is in use. That was changed recently: I'll look into the situation with your server version and our current client versions. | |
| ID: 58676 | Rating: 0 | rate:
| |
|
abouh Project administrator Project developer Project tester Project scientist Send message Joined: 31 May 21 Posts: 200 Credit: 0 RAC: 0 Level Scientific publications | |
|
Definitely only the latest version 403 should be sent. Thanks for letting us know. | |
| ID: 58677 | Rating: 0 | rate:
| |
|
Richard Haselgrove Send message Joined: 11 Jul 09 Posts: 1589 Credit: 6,676,344,351 RAC: 9,081,515 Level Scientific publications | |
|
BOINC GPU apps, wrapper apps, and process priority | |
| ID: 58678 | Rating: 0 | rate:
| |
|
abouh Project administrator Project developer Project tester Project scientist Send message Joined: 31 May 21 Posts: 200 Credit: 0 RAC: 0 Level Scientific publications | |
|
We have deprecated v4.01 All are failing with "ModuleNotFoundError: No module named 'yaml'". should not happen any more. And all jobs should use v4.03 ____________ | |
| ID: 58696 | Rating: 0 | rate:
| |
|
Greg _BE Send message Joined: 30 Jun 14 Posts: 127 Credit: 110,756,939 RAC: 4,306 Level Scientific publications | |
|
abouh, | |
| ID: 58752 | Rating: 0 | rate:
| |
|
Keith Myers Send message Joined: 13 Dec 17 Posts: 1313 Credit: 6,016,967,459 RAC: 9,922,728 Level Scientific publications | |
But here is something interesting, the CPU value according to BOINC Tasks is 221%! Because the task was actually using a little more than two cores to process the work. Why I have set Python task to allocate 3 cpu threads for BOINC scheduling. | |
| ID: 58753 | Rating: 0 | rate:
| |
|
Greg _BE Send message Joined: 30 Jun 14 Posts: 127 Credit: 110,756,939 RAC: 4,306 Level Scientific publications | |
But here is something interesting, the CPU value according to BOINC Tasks is 221%! Ok...interesting, but what accounts for the lack of progress in 30 mins on this task that I just killed and the exit child error and blow up on the previous Python? I mean really...0% with 2 decimal points, 7.88 for more than 30 minutes? I don't know of any project that can't even 1/100th in 30 minutes. I've seen my share of slow tasks in other projects, but this one...wow.... And how do you go about setting just python for 3 cpu cores? That's beyond my knowledge level. | |
| ID: 58754 | Rating: 0 | rate:
| |
|
Keith Myers Send message Joined: 13 Dec 17 Posts: 1313 Credit: 6,016,967,459 RAC: 9,922,728 Level Scientific publications | |
|
You use an app_config.xml file in the project like this: | |
| ID: 58755 | Rating: 0 | rate:
| |
|
Greg _BE Send message Joined: 30 Jun 14 Posts: 127 Credit: 110,756,939 RAC: 4,306 Level Scientific publications | |
You use an app_config.xml file in the project like this: Ok thanks. I will make that file tomorrow or this weekend. To tired to try that tonight. | |
| ID: 58762 | Rating: 0 | rate:
| |
|
ServicEnginIC Send message Joined: 24 Sep 10 Posts: 572 Credit: 7,515,397,024 RAC: 10,445,831 Level Scientific publications | |
We have deprecated v4.01 I've recently reset Gpugrid project at every of my hosts, but I've still received v4.01 at several of them, and failed with the mentioned error. Some subsequent v4.03 resends for the same tasks have eventually succeeded at other hosts. | |
| ID: 58767 | Rating: 0 | rate:
| |
|
Keith Myers Send message Joined: 13 Dec 17 Posts: 1313 Credit: 6,016,967,459 RAC: 9,922,728 Level Scientific publications | |
|
Unfortunately the admins never yanked the malformed tasks from distribution. | |
| ID: 58768 | Rating: 0 | rate:
| |
|
abouh Project administrator Project developer Project tester Project scientist Send message Joined: 31 May 21 Posts: 200 Credit: 0 RAC: 0 Level Scientific publications | |
|
Sorry for the late reply Greg _BE, I was away for the last 5 days. Thank you very much for the detailed report. Exit status 195 (0xc3) EXIT_CHILD_FAILED Seems like the process failed after raising the exception: "The wandb backend process has shutdown". wandb is the python package we use to send out logs about the agent training process. It provides useful information to better understand the task results. Seems like the process failed and then the whole task got stuck, that is why no progress was being made. Since it reached 7.88% progress, I assume it worked well until then. I need to review other jobs to see why this could be happening and if it happened in other machines. We had not detected this issue before. Thanks for bringing it up. ---------- 2. Time estimation is not right for now due to the way BOINC makes it, Richard provided a very complete explanation in a previous posts. We hope it will improve over time... for now be aware that is it completely wrong. ---------- 3. Regarding this error: OSError: [WinError 1455] The paging file is too small for this operation to complete It is related to using pytorch in windows. It is explained here: https://stackoverflow.com/questions/64837376/how-to-efficiently-run-multiple-pytorch-processes-models-at-once-traceback We are applying this solution to mitigate the error, but for now it can not be eliminated completely. ____________ | |
| ID: 58770 | Rating: 0 | rate:
| |
|
abouh Project administrator Project developer Project tester Project scientist Send message Joined: 31 May 21 Posts: 200 Credit: 0 RAC: 0 Level Scientific publications | |
|
Seems like deprecating the version v4.01 did not work then... I will check if there is anything else we can do to enforce usage of v4.03 over the old one. | |
| ID: 58771 | Rating: 0 | rate:
| |
|
Keith Myers Send message Joined: 13 Dec 17 Posts: 1313 Credit: 6,016,967,459 RAC: 9,922,728 Level Scientific publications | |
|
You need a to send a message to all hosts when they connect to the scheduler to delete the 4.01 application from the host physically and to delete the entry in the client_state.xml file | |
| ID: 58772 | Rating: 0 | rate:
| |
|
abouh Project administrator Project developer Project tester Project scientist Send message Joined: 31 May 21 Posts: 200 Credit: 0 RAC: 0 Level Scientific publications | |
|
I sent a batch which will fail with yaml.constructor.ConstructorError: could not determine a constructor for the tag 'tag:yaml.org,2002:python/object/apply:numpy.core.multiarray.scalar' It is just an error with the experiment configuration. I immediately cancelled the experiment and fixed the configuration, but the tasks were already sent. I am very sorry for the inconvenience. Fortunately the jobs will fail right after starting, so no need to kill them. The another batch contains jobs with the fixed configuration. ____________ | |
| ID: 58773 | Rating: 0 | rate:
| |
|
Boca Raton Community HS Send message Joined: 27 Aug 21 Posts: 36 Credit: 3,441,856,809 RAC: 24,170 Level Scientific publications | |
|
I was not getting too many of the python work units, but I recently received/completed one. I know they take... a while to complete. | |
| ID: 58774 | Rating: 0 | rate:
| |
|
Keith Myers Send message Joined: 13 Dec 17 Posts: 1313 Credit: 6,016,967,459 RAC: 9,922,728 Level Scientific publications | |
|
I get the full "quick" credits for my Python tasks because I normally crunch them in 5-8 hours. | |
| ID: 58775 | Rating: 0 | rate:
| |
|
Boca Raton Community HS Send message Joined: 27 Aug 21 Posts: 36 Credit: 3,441,856,809 RAC: 24,170 Level Scientific publications | |
I get the full "quick" credits for my Python tasks because I normally crunch them in 5-8 hours. Got it. Thanks! I think I am confused why this task took so long to report. What is usually the "bottleneck" when running these tasks? | |
| ID: 58776 | Rating: 0 | rate:
| |
|
Ian&Steve C. Send message Joined: 21 Feb 20 Posts: 1048 Credit: 40,228,383,983 RAC: 547,485 Level Scientific publications | |
I get the full "quick" credits for my Python tasks because I normally crunch them in 5-8 hours. these tasks are multi-core tasks. they will use a lot of cores (maybe up to 32 threads?). are you running CPU work from other projects? if you are then it's probably starved on CPU resources trying to run the Python task. ____________ | |
| ID: 58777 | Rating: 0 | rate:
| |
|
Richard Haselgrove Send message Joined: 11 Jul 09 Posts: 1589 Credit: 6,676,344,351 RAC: 9,081,515 Level Scientific publications | |
these tasks are multi-core tasks. they will use a lot of cores (maybe up to 32 threads?). are you running CPU work from other projects? if you are then it's probably starved on CPU resources trying to run the Python task. The critical point being that they aren't declared to BOINC as needing multiple cores, so BOINC doesn't automatically clear extra CPU space for them to run in. | |
| ID: 58778 | Rating: 0 | rate:
| |
|
abouh Project administrator Project developer Project tester Project scientist Send message Joined: 31 May 21 Posts: 200 Credit: 0 RAC: 0 Level Scientific publications | |
|
Right, I wish there was a way to specify that to BOINC on our side... does adjusting the app_config.xml help? I guess that has to be done of the user side | |
| ID: 58779 | Rating: 0 | rate:
| |
|
abouh Project administrator Project developer Project tester Project scientist Send message Joined: 31 May 21 Posts: 200 Credit: 0 RAC: 0 Level Scientific publications | |
|
yes, the tasks run 32 agent environments in parallel python processes. Definitely the bottleneck could be the CPU because BOINC is not aware of it. | |
| ID: 58780 | Rating: 0 | rate:
| |
|
Boca Raton Community HS Send message Joined: 27 Aug 21 Posts: 36 Credit: 3,441,856,809 RAC: 24,170 Level Scientific publications | |
|
Thank you all for the replies- this was exactly the issue. I will keep that in mind if I receive another one of these work units. Theoretically, is it possible to run several of these tasks in parallel on the same GPU, since it really is not too GPU intensive and I have enough cores/memory? | |
| ID: 58781 | Rating: 0 | rate:
| |
|
Ian&Steve C. Send message Joined: 21 Feb 20 Posts: 1048 Credit: 40,228,383,983 RAC: 547,485 Level Scientific publications | |
Thank you all for the replies- this was exactly the issue. I will keep that in mind if I receive another one of these work units. Theoretically, is it possible to run several of these tasks in parallel on the same GPU, since it really is not too GPU intensive and I have enough cores/memory? Only if you have more than 64 threads per GPU available and you stop processing of any existing CPU work. ____________ | |
| ID: 58782 | Rating: 0 | rate:
| |
|
captainjack Send message Joined: 9 May 13 Posts: 171 Credit: 2,592,346,788 RAC: 200,707 Level Scientific publications | |
|
abouh asked Right, I wish there was a way to specify that to BOINC on our side... does adjusting the app_config.xml help? I guess that has to be done of the user side I tried that, but boinc manager on my pc will overallocate CPU's. I am currently running multicore atlas cpu tasks from lhc alongside the python tasks from gpugrid. The atlas tasks are set to use 8 CPU's and the python tasks are set to use 10 CPU's. The example for this response is on an AMD cpu with 8 cores/16 threads. BOINC is set to use 15 threads. It will run one gpugrid python 10 thread task and one lhc 8 thread task at the same time. That is 18 threads running on a 15 thread cpu. Here is my app_config for gpugrid: <app_config> <app> <name>acemd3</name> <gpu_versions> <gpu_usage>1</gpu_usage> <cpu_usage>1</cpu_usage> </gpu_versions> </app> <app> <name>PythonGPU</name> <cpu_usage>10</cpu_usage> <gpu_versions> <gpu_usage>1</gpu_usage> <cpu_usage>10</cpu_usage> </gpu_versions> <app_version> <app_name>PythonGPU</app_name> <plan_class>cuda1121</plan_class> <avg_ncpus>10</avg_ncpus> <ngpus>1</ngpus> <cmdline>--nthreads 10</cmdline> </app_version> </app> <app> <name>PythonGPUbeta</name> <cpu_usage>10</cpu_usage> <gpu_versions> <gpu_usage>1</gpu_usage> <cpu_usage>10</cpu_usage> </gpu_versions> <app_version> <app_name>PythonGPU</app_name> <plan_class>cuda1121</plan_class> <avg_ncpus>10</avg_ncpus> <ngpus>1</ngpus> <cmdline>--nthreads 10</cmdline> </app_version> </app> <app> <name>Python</name> <cpu_usage>10</cpu_usage> <gpu_versions> <gpu_usage>1</gpu_usage> <cpu_usage>10</cpu_usage> </gpu_versions> <app_version> <app_name>PythonGPU</app_name> <plan_class>cuda1121</plan_class> <avg_ncpus>10</avg_ncpus> <ngpus>1</ngpus> <cmdline>--nthreads 10</cmdline> </app_version> </app> <app> <name>acemd4</name> <gpu_versions> <gpu_usage>1</gpu_usage> <cpu_usage>1</cpu_usage> </gpu_versions> </app> </app_config> And here is my app_config for lhc: <app_config> <app> <name>ATLAS</name> <cpu_usage>8</cpu_usage> </app> <app_version> <app_name>ATLAS</app_name> <plan_class>vbox64_mt_mcore_atlas</plan_class> <avg_ncpus>8</avg_ncpus> <cmdline>--nthreads 8</cmdline> </app_version> </app_config> If anyone has any suggestions for changes to the app_config files, please let me know. | |
| ID: 58783 | Rating: 0 | rate:
| |
|
abouh Project administrator Project developer Project tester Project scientist Send message Joined: 31 May 21 Posts: 200 Credit: 0 RAC: 0 Level Scientific publications | |
|
I can run 2 jobs manually on my machine with 12 CPUs, in parallel. They are slower than a single job, but much faster than running them sequentially. | |
| ID: 58785 | Rating: 0 | rate:
| |
|
Richard Haselgrove Send message Joined: 11 Jul 09 Posts: 1589 Credit: 6,676,344,351 RAC: 9,081,515 Level Scientific publications | |
However, I think currently GPUGrid automatically assigns one job per GPU, with the environment variable GPU_DEVICE_NUM. Normally, the user's BOINC client will assign the GPU device number, and this will be conveyed to the job by the wrapper. You can easily run two jobs per GPU (both with the same device number), and give them both two full CPU cores each, by using an app_config.xml file including ... <gpu_versions> <gpu_usage>0.5</gpu_usage> <cpu_usage>2.0</cpu_usage> </gpu_versions> ... (full details in the user manual) | |
| ID: 58786 | Rating: 0 | rate:
| |
|
abouh Project administrator Project developer Project tester Project scientist Send message Joined: 31 May 21 Posts: 200 Credit: 0 RAC: 0 Level Scientific publications | |
|
I see, thanks for the clarification | |
| ID: 58788 | Rating: 0 | rate:
| |
|
Greg _BE Send message Joined: 30 Jun 14 Posts: 127 Credit: 110,756,939 RAC: 4,306 Level Scientific publications | |
|
I guess I am going to have to give up on this project. | |
| ID: 58789 | Rating: 0 | rate:
| |
|
abouh Project administrator Project developer Project tester Project scientist Send message Joined: 31 May 21 Posts: 200 Credit: 0 RAC: 0 Level Scientific publications | |
|
This task is from a batch of a wrongly configured jobs. It is an error on our side. It was immediately corrected, but the jobs were already sent, and could not be cancelled. They crash after starting to runm, but it is just this batch. The following batches work normally. | |
| ID: 58790 | Rating: 0 | rate:
| |
|
Greg _BE Send message Joined: 30 Jun 14 Posts: 127 Credit: 110,756,939 RAC: 4,306 Level Scientific publications | |
This task is from a batch of a wrongly configured jobs. It is an error on our side. It was immediately corrected, but the jobs were already sent, and could not be cancelled. They crash after starting to runm, but it is just this batch. The following batches work normally. ok...waiting in line for the next batch. | |
| ID: 58791 | Rating: 0 | rate:
| |
|
Boca Raton Community HS Send message Joined: 27 Aug 21 Posts: 36 Credit: 3,441,856,809 RAC: 24,170 Level Scientific publications | |
|
I am still attempting to diagnose why these tasks are taking the system so long to complete. I changed the config to "reserve" 32 cores for these tasks. I did also make a change so I have two of these tasks running simultaneously- I am not clear on these tasks and multithreading. The system running them has 56 physical cores across two CPUs (112 logical). Are the "32" cores used for one of these tasks physical or logical? Also, I am relatively confident the GPUs can handle this (RTX A6000) but let me know if I am missing something. | |
| ID: 58830 | Rating: 0 | rate:
| |
|
Keith Myers Send message Joined: 13 Dec 17 Posts: 1313 Credit: 6,016,967,459 RAC: 9,922,728 Level Scientific publications | |
|
Why do you think the tasks are running abnormally long? | |
| ID: 58831 | Rating: 0 | rate:
| |
|
Bedrich Hajek Send message Joined: 28 Mar 09 Posts: 477 Credit: 9,337,172,716 RAC: 10,849,756 Level Scientific publications | |
Why do you think the tasks are running abnormally long? They should be put back into the beta category. They still have too many bugs and need more work. It looks like someone was in a hurry to leave for summer vacation. I decided to stop crunching them, for now. Of course, there isn't much to crunch here anyway, right now. There is always next fall to fix this..................... | |
| ID: 58832 | Rating: 0 | rate:
| |
|
Richard Haselgrove Send message Joined: 11 Jul 09 Posts: 1589 Credit: 6,676,344,351 RAC: 9,081,515 Level Scientific publications | |
Are you being confused by the cpu and gpu runtimes on the task? They are declared to use less than 1 CPU (and that's all BOINC knows about), but in reality they use much more. This website confuses matters by mis-reporting the elapsed time as the total (summed over all cores) CPU time. The only way to be exactly sure what has happened is to examine the job_log_[GPUGrid] file on your local machine. The third numeric column ('ct ...') is the total CPU time, summed over all cores: the penultimate column ('et ...') is the elapsed - wall clock - time for the task as a whole. Locally, ct will be above et for the task as a whole, but on this website, they will be reported as the same. | |
| ID: 58833 | Rating: 0 | rate:
| |
|
Keith Myers Send message Joined: 13 Dec 17 Posts: 1313 Credit: 6,016,967,459 RAC: 9,922,728 Level Scientific publications | |
|
I'm not having any issues with them on Linux. I don't know how that compares to Windows hosts. | |
| ID: 58834 | Rating: 0 | rate:
| |
|
abouh Project administrator Project developer Project tester Project scientist Send message Joined: 31 May 21 Posts: 200 Credit: 0 RAC: 0 Level Scientific publications | |
|
The 32 cores are logical, python processes running in parallel. I can run them locally in a 12 CPU machine. The GPU should be fine as well, so you are correct about that. | |
| ID: 58844 | Rating: 0 | rate:
| |
|
abouh Project administrator Project developer Project tester Project scientist Send message Joined: 31 May 21 Posts: 200 Credit: 0 RAC: 0 Level Scientific publications | |
|
We decided to remove the beta flag from the current version of the python app when we found it to work without errors in a reasonable number hosts. We are aware that, even though we do testing it in our local linux and windows machines, there is a vast variety of configurations, versions and resource capabilities among the hosts, and it will not work in all of them. | |
| ID: 58845 | Rating: 0 | rate:
| |
|
Richard Haselgrove Send message Joined: 11 Jul 09 Posts: 1589 Credit: 6,676,344,351 RAC: 9,081,515 Level Scientific publications | |
|
I'm away from my machines at the moment, but can confirm that's the case. | |
| ID: 58846 | Rating: 0 | rate:
| |
|
abouh Project administrator Project developer Project tester Project scientist Send message Joined: 31 May 21 Posts: 200 Credit: 0 RAC: 0 Level Scientific publications | |
|
I am not sure about the acemd tasks, but for python tasks, I will increase the amount of tasks progressively. | |
| ID: 58847 | Rating: 0 | rate:
| |
|
Boca Raton Community HS Send message Joined: 27 Aug 21 Posts: 36 Credit: 3,441,856,809 RAC: 24,170 Level Scientific publications | |
|
Thanks for this info. Here is the log file for a recently completed task: | |
| ID: 58848 | Rating: 0 | rate:
| |
|
Keith Myers Send message Joined: 13 Dec 17 Posts: 1313 Credit: 6,016,967,459 RAC: 9,922,728 Level Scientific publications | |
Thanks for this info. Here is the log file for a recently completed task: No. That is incorrect. You cannot use the clocktime reported in the task. That will accumulate over however many cpu threads the task is allowed to show to BOINC. Blame BOINC for this issue not the application. Look at the sent time and the returned time to calculate how long the task actually took to process. Returned time minus the sent time = length of time to process. | |
| ID: 58853 | Rating: 0 | rate:
| |
|
Keith Myers Send message Joined: 13 Dec 17 Posts: 1313 Credit: 6,016,967,459 RAC: 9,922,728 Level Scientific publications | |
|
BOINC just does not know how to account for these Python tasks which act "sorta" like an MT task. | |
| ID: 58855 | Rating: 0 | rate:
| |
|
Richard Haselgrove Send message Joined: 11 Jul 09 Posts: 1589 Credit: 6,676,344,351 RAC: 9,081,515 Level Scientific publications | |
1653158519 ue 148176.747654 ct 3544023.000000 fe 1000000000000000000 nm e5a63-ABOU_rnd_ppod_demo_sharing_large-0-1-RND5179_0 et 117973.295733 es 0 Actually, that line (from the client job log) actually is a useful source of information. It contains both ct 3544023.000000 which is the CPU or core time - as you say, it dates back to the days when CPUs only had one core. But now, it comprises the sum over all of however many cores are used. and et 117973.295733 That's the elapsed time (wallclock measure) which was added when GPU computing was first introduced and cpu time was not longer a reliable indicator of work done. I agree that many outdated legacy assumptions remain active in BOINC, but I think it's got beyond the point when mere tinkering could fix it - we really need a full Mark 2 rewrite. But that seems unlikely under the current management. | |
| ID: 58856 | Rating: 0 | rate:
| |
|
Keith Myers Send message Joined: 13 Dec 17 Posts: 1313 Credit: 6,016,967,459 RAC: 9,922,728 Level Scientific publications | |
|
OK, so here is a back of the napkin calculation on how long the task actually took to crunch | |
| ID: 58858 | Rating: 0 | rate:
| |
|
Richard Haselgrove Send message Joined: 11 Jul 09 Posts: 1589 Credit: 6,676,344,351 RAC: 9,081,515 Level Scientific publications | |
|
Well, since there's also a 'nm' (name) field in the client job log, we can find the rest: 04:44:21 (34948): .\7za.exe exited; CPU time 9.890625 13:32:28 (7456): wrapper (7.9.26016): starting(that looks like a restart) Then some more of the same, and finally 14:41:51 (28304): python.exe exited; CPU time 2816214.046875 | |
| ID: 58859 | Rating: 0 | rate:
| |
|
Keith Myers Send message Joined: 13 Dec 17 Posts: 1313 Credit: 6,016,967,459 RAC: 9,922,728 Level Scientific publications | |
|
| |
| ID: 58860 | Rating: 0 | rate:
| |
|
Boca Raton Community HS Send message Joined: 27 Aug 21 Posts: 36 Credit: 3,441,856,809 RAC: 24,170 Level Scientific publications | |
That is what I am confused about. I can tell you that these calculations of time seem accurate- it was somewhere around 24 hours that it was actually running. Also, the CPU was running closer to 3.1Ghz (boost). It barely pushed the GPU when running. Nothing changed with time when I reserved 32 cores for these tasks. I really can't nail down the issue. | |
| ID: 58861 | Rating: 0 | rate:
| |
|
Richard Haselgrove Send message Joined: 11 Jul 09 Posts: 1589 Credit: 6,676,344,351 RAC: 9,081,515 Level Scientific publications | |
|
As abouh has posted previously, the two resource types are used alternately - "cyclical GPU load is expected in Reinforcement Learning algorithms. Whenever GPU load in lower, CPU usage should increase." (message 58590). Any instantaneous observation won't reveal the full situation: either CPU will be high, and GPU low, or vice-versa. | |
| ID: 58862 | Rating: 0 | rate:
| |
|
Boca Raton Community HS Send message Joined: 27 Aug 21 Posts: 36 Credit: 3,441,856,809 RAC: 24,170 Level Scientific publications | |
|
Yep- I observe the alternation. When I suspend all other work units, I can see that just one of these tasks will use a little more than half of the logical processors. I know it has been talked about that although it says it uses 1 processor (or, 0.996, to be exact) that it uses more. I am running E@H work units and I think that running both is choking the CPU. Is there a way to limit the processor count that these python tasks use? In the past, I changed the app config to use 32, but it did not seem to speed anything up, even though they were reserved for the work unit. | |
| ID: 58863 | Rating: 0 | rate:
| |
|
ServicEnginIC Send message Joined: 24 Sep 10 Posts: 572 Credit: 7,515,397,024 RAC: 10,445,831 Level Scientific publications | |
As abouh has posted previously, the two resource types are used alternately - "cyclical GPU load is expected in Reinforcement Learning algorithms. Whenever GPU load in lower, CPU usage should increase. This can be very well graphically noticed at the following two images. Higher CPU - Lower GPU usage cycle: 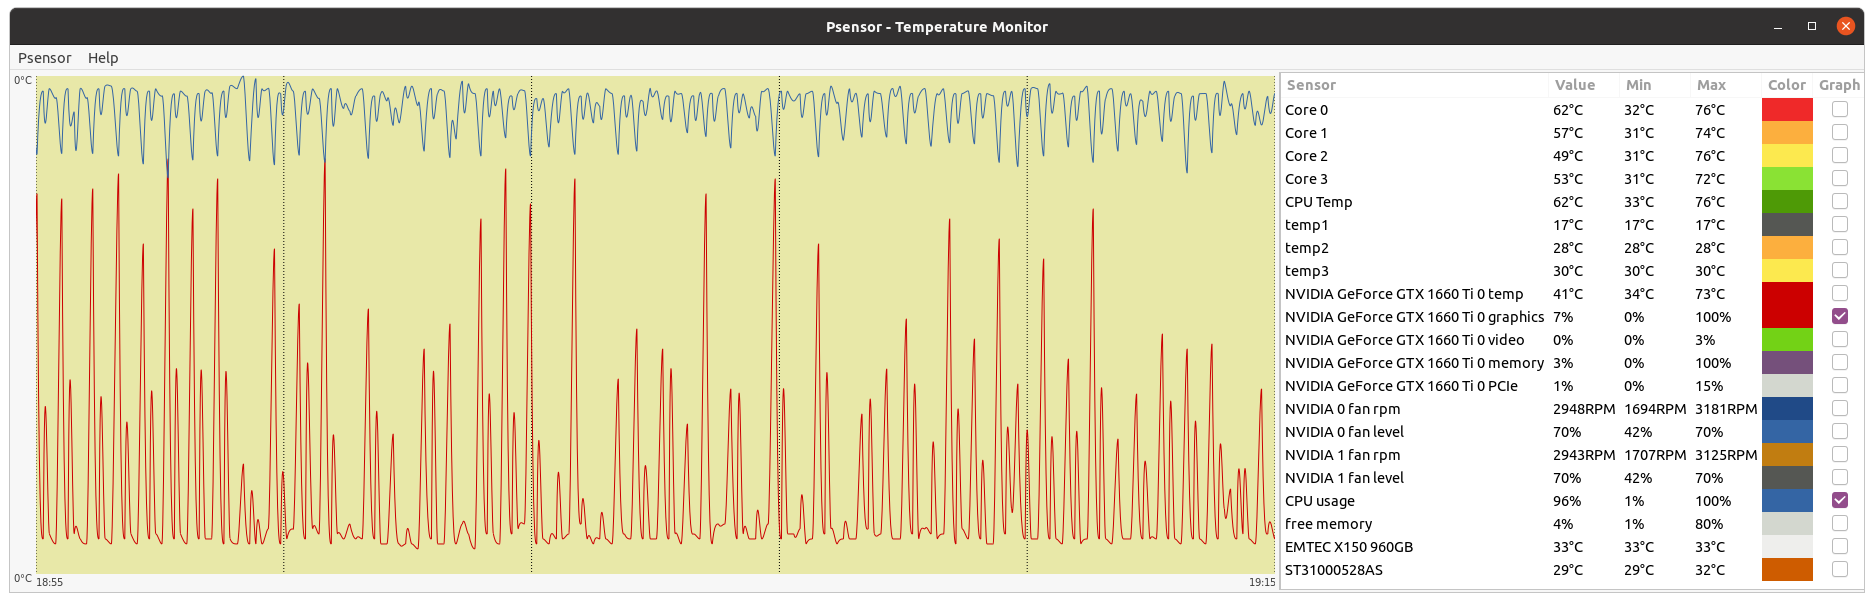 Higher GPU - Lower CPU usage cycle: 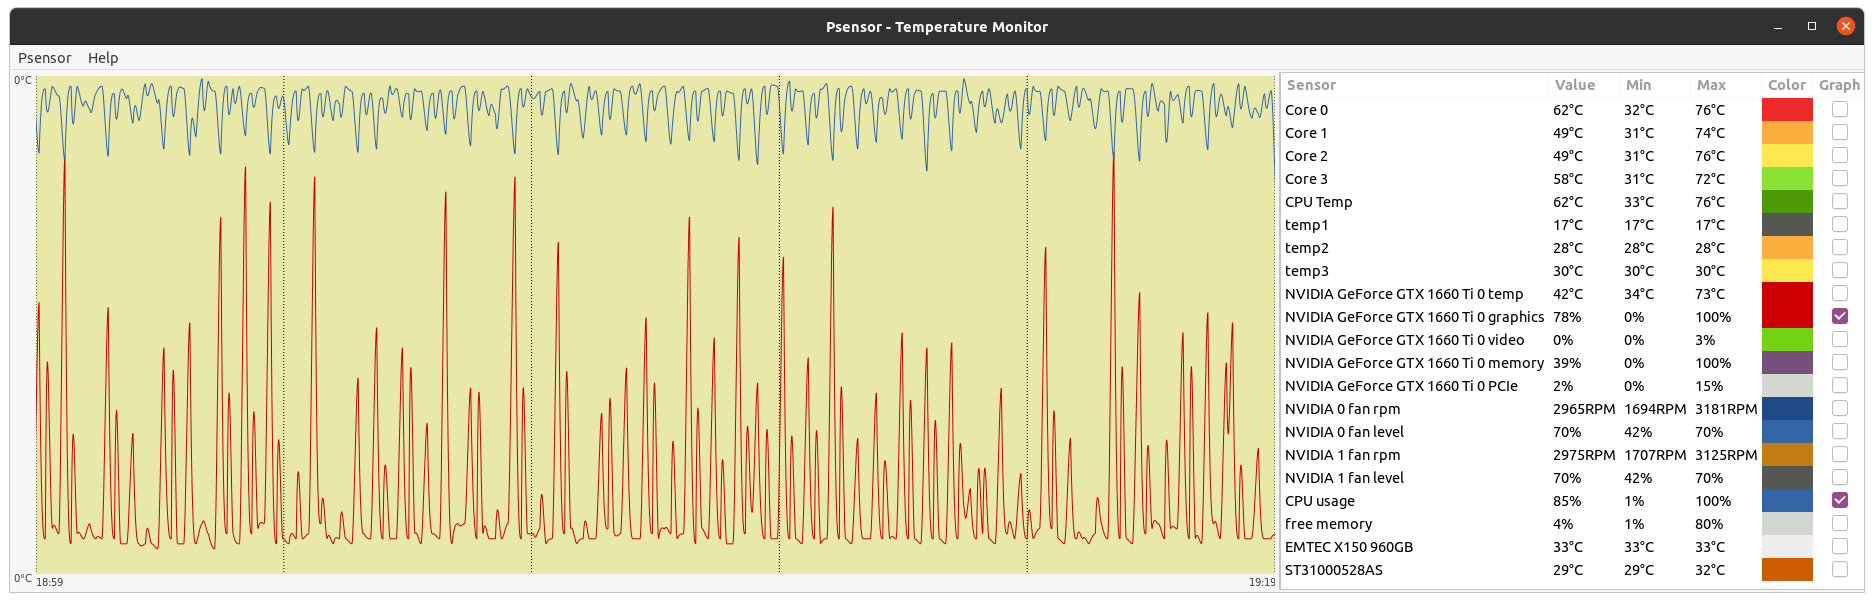 CPU and GPU usage graphics follow an anti cyclical pattern. | |
| ID: 58864 | Rating: 0 | rate:
| |
|
Keith Myers Send message Joined: 13 Dec 17 Posts: 1313 Credit: 6,016,967,459 RAC: 9,922,728 Level Scientific publications | |
Is there a way to limit the processor count that these python tasks use? In the past, I changed the app config to use 32, but it did not seem to speed anything up, even though they were reserved for the work unit. No there isn't as the user. These are not real MT tasks or any form that BOINC recognizes and provides some configuration options. Your only solution is to only run one at a time via an max_concurrent statement in an app_config.xml file and then also restrict the number of cores being allowed to be used by your other projects. That said, I don't know why you are having such difficulties. Maybe chalk it up to Windows, I don't know. I run 3 other cpu projects at the same times as I run the GPUGrid Python on GPU tasks with 28-46 cpu cores being occupied by Universe, TN-Grid or yoyo depending on the host. Every host primarily runs Universe as the major cpu project. No impact on the python tasks while running the other cpu apps. | |
| ID: 58865 | Rating: 0 | rate:
| |
|
ServicEnginIC Send message Joined: 24 Sep 10 Posts: 572 Credit: 7,515,397,024 RAC: 10,445,831 Level Scientific publications | |
No impact on the python tasks while running the other cpu apps. Conversely, I notice a performance loss on other CPU tasks when python tasks are in execution. I processed yesterday python task e7a30-ABOU_rnd_ppod_demo_sharing_large-0-1-RND2847_2 at my host #186626 It was received at 11:33 UTC, and result was returned on 22:50 UTC At the same period, PrimeGrid PPS-MEGA CPU tasks were also being processed. The medium processing time for eighteen (18) PPS-MEGA CPU tasks was 3098,81 seconds. The medium processing time for 18 other PPS-MEGA CPU tasks processed outside that period was 2699,11 seconds. This represents an extra processing time of about 400 seconds per task, or about a 12,9% performance loss. There is not such a noticeable difference when running Gpugrid ACEMD tasks. | |
| ID: 58866 | Rating: 0 | rate:
| |
|
Keith Myers Send message Joined: 13 Dec 17 Posts: 1313 Credit: 6,016,967,459 RAC: 9,922,728 Level Scientific publications | |
|
I also notice an impact on my running Universe tasks. Generally adds 300 seconds to the normal computation times when running in conjunction with a python task. | |
| ID: 58867 | Rating: 0 | rate:
| |
|
captainjack Send message Joined: 9 May 13 Posts: 171 Credit: 2,592,346,788 RAC: 200,707 Level Scientific publications | |
|
Windows 10 machine running task 32899765. Had a power outage. When the power came back on, task was restarted but just sat there doing nothing. The stderr.txt file showed the following error: file pythongpu_windows_x86_64__cuda102.tar Task was stalled waiting on a response. BOINC was stopped and the pythongpu_windows_x86_64__cuda102.tar file was removed from the slots folder. Computer was restarted then the task was restarted. Then the following error message appeared several times in the stderr.txt file. OSError: [WinError 1455] The paging file is too small for this operation to complete. Error loading "C:\ProgramData\BOINC\slots\0\lib\site-packages\torch\lib\caffe2_detectron_ops_gpu.dll" or one of its dependencies. Page file size was increased to 64000MB and rebooted. Started task again and still got the error message about page file size too small. Then task abended. If you need more info about this task, please let me know. | |
| ID: 58871 | Rating: 0 | rate:
| |
|
abouh Project administrator Project developer Project tester Project scientist Send message Joined: 31 May 21 Posts: 200 Credit: 0 RAC: 0 Level Scientific publications | |
|
Thank you captainjack for the info. (Y)es / (N)o / (A)lways / (S)kip all / A(u)to rename all / (Q)uit? The job command line is the following: 7za.exe pythongpu_windows_x86_64__cuda102.tar -y and I got from the application documentation (https://info.nrao.edu/computing/guide/file-access-and-archiving/7zip/7z-7za-command-line-guide): 7-Zip will prompt the user before overwriting existing files unless the user specifies the -y So essentially -y assumes "Yes" on all Queries. Honestly I am confused by this behaviour, thanks for pointing it out. Maybe I am missing the x, as in 7za.exe x pythongpu_windows_x86_64__cuda102.tar -y I will test it on the beta app. 2. Regarding the other error OSError: [WinError 1455] The paging file is too small for this operation to complete. Error loading "C:\ProgramData\BOINC\slots\0\lib\site-packages\torch\lib\caffe2_detectron_ops_gpu.dll" or one of its dependencies. is related to pytorch and nvidia and it only affects some windows machines. It is explained here: https://stackoverflow.com/questions/64837376/how-to-efficiently-run-multiple-pytorch-processes-models-at-once-traceback TL;DR: Windows and Linux treat multiprocessing in python differently, and in windows each process commits much more memory, especially when using pytorch. We use the script suggested in the link to mitigate the problem, but it could be that for some machines memory is still insufficient. Does that make sense in your case? ____________ | |
| ID: 58876 | Rating: 0 | rate:
| |
|
captainjack Send message Joined: 9 May 13 Posts: 171 Credit: 2,592,346,788 RAC: 200,707 Level Scientific publications | |
|
Thank you abouh for responding, | |
| ID: 58878 | Rating: 0 | rate:
| |
|
abouh Project administrator Project developer Project tester Project scientist Send message Joined: 31 May 21 Posts: 200 Credit: 0 RAC: 0 Level Scientific publications | |
|
Seems like here are some possible workarounds:
and If it's of any value, I ended up setting the values into manual and some ridiculous amount of 360GB as the minimum and 512GB for the maximum. I also added an extra SSD and allocated all of it to Virtual memory. This solved the problem and now I can run up to 128 processes using pytorch and CUDA. Maybe it can be helpful for someone ____________ | |
| ID: 58879 | Rating: 0 | rate:
| |
|
bibi Send message Joined: 4 May 17 Posts: 14 Credit: 10,617,879,643 RAC: 19,583,410 Level Scientific publications | |
|
Hi abouh, | |
| ID: 58880 | Rating: 0 | rate:
| |
|
WR-HW95 Send message Joined: 16 Dec 08 Posts: 7 Credit: 1,426,626,313 RAC: 410 Level Scientific publications | |
|
So whats going on here? | |
| ID: 58881 | Rating: 0 | rate:
| |
|
abouh Project administrator Project developer Project tester Project scientist Send message Joined: 31 May 21 Posts: 200 Credit: 0 RAC: 0 Level Scientific publications | |
|
The command line 7za.exe pythongpu_windows_x86_64__cuda102.tar.gz works fine if the job is executed without interruptions. However, in case the job is interrupted and restarted later, the command is executed again. Then, 7za needs to know whether or not to replace the already existing files with the new ones. The flag -y is just to make sure the script does not get stuck in that command prompt waiting for an answer. ____________ | |
| ID: 58883 | Rating: 0 | rate:
| |
|
abouh Project administrator Project developer Project tester Project scientist Send message Joined: 31 May 21 Posts: 200 Credit: 0 RAC: 0 Level Scientific publications | |
|
Unfortunately recent versions of PyTorch do not support all GPU's, older ones might not be compatible... RuntimeError: CUDA out of memory. Tried to allocate 446.00 MiB (GPU 0; 11.00 GiB total capacity; 470.54 MiB already allocated; 8.97 GiB free; 492.00 MiB reserved in total by PyTorch) If reserved memory is >> allocated memory try setting max_split_size_mb to avoid fragmentation. See documentation for Memory Management and PYTORCH_CUDA_ALLOC_CONF does it happen recurrently in the same machine? or depending on the job? ____________ | |
| ID: 58884 | Rating: 0 | rate:
| |
|
Keith Myers Send message Joined: 13 Dec 17 Posts: 1313 Credit: 6,016,967,459 RAC: 9,922,728 Level Scientific publications | |
So whats going on here? The problem is not with the card but with the Windows environment. I have no issues running the Python on GPU tasks in Linux on my 1080 Ti card. https://www.gpugrid.net/results.php?hostid=456812 | |
| ID: 58886 | Rating: 0 | rate:
| |
|
STARBASEn Send message Joined: 17 Feb 09 Posts: 91 Credit: 1,603,303,394 RAC: 0 Level Scientific publications | |
|
Well so far, these new python WU's have been consistently completing and even surviving multiple reboots, OS kernel upgrades, and OS upgrades: | |
| ID: 58906 | Rating: 0 | rate:
| |
|
Keith Myers Send message Joined: 13 Dec 17 Posts: 1313 Credit: 6,016,967,459 RAC: 9,922,728 Level Scientific publications | |
|
Yes, one nice thing about the Python gpu tasks is that they survive a reboot and can be restarted on a different gpu without erroring. | |
| ID: 58907 | Rating: 0 | rate:
| |
|
STARBASEn Send message Joined: 17 Feb 09 Posts: 91 Credit: 1,603,303,394 RAC: 0 Level Scientific publications | |
Yes, one nice thing about the Python gpu tasks is that they survive a reboot and can be restarted on a different gpu without erroring. Good to know as I did not try a driver update or using a different GPU on a WU in progress. I do think BOINC needs to patch their estimated time to completion. XXXdays remaining makes it impossible to have any in a cache. | |
| ID: 58915 | Rating: 0 | rate:
| |
|
Keith Myers Send message Joined: 13 Dec 17 Posts: 1313 Credit: 6,016,967,459 RAC: 9,922,728 Level Scientific publications | |
|
I haven't had any reason to carry a cache. I have my cache level set at only one task for each host as I don't want GPUGrid to monopolize my hosts and compete with my other projects. | |
| ID: 58919 | Rating: 0 | rate:
| |
|
Keith Myers Send message Joined: 13 Dec 17 Posts: 1313 Credit: 6,016,967,459 RAC: 9,922,728 Level Scientific publications | |
Yes, one nice thing about the Python gpu tasks is that they survive a reboot and can be restarted on a different gpu without erroring. BOINC would have to completely rewrite that part of the code. The fact that these tasks run on both the cpu and gpu makes them impossible to decipher by BOINC. The closest mechanism is the MT or multi-task category but that only knows about cpu tasks which run solely on the cpu. | |
| ID: 58920 | Rating: 0 | rate:
| |
|
STARBASEn Send message Joined: 17 Feb 09 Posts: 91 Credit: 1,603,303,394 RAC: 0 Level Scientific publications | |
BOINC would have to completely rewrite that part of the code. The fact that these tasks run on both the cpu and gpu makes them impossible to decipher by BOINC. I think BOINC uses the CPU excluively for their Estimated Time to Completion algorithm all WU's including those using a GPU which makes sense since the job cannot complete until both processor's work are complete. Observing GPU work with E@H, it appears that the GPU finishes first and the CPU continues for a period of time to do what is necessary to wrap the job up for return and those BOINC ETC's are fairly accurate. It is the multi-thread WU's mentioned that appears to be throwing a monkey wrench at the ETC like these python jobs. From my observations, the python WU's use 32 processes regardless of actual system configuration. I have 2 Ryzen 16 core and my old FX-8350 8 core and they each run 32 processes each WU. It seems to me that the existing algorithm could be used in a modular fashion by assuming a single thread CPU job for the MT WU then calculating the estimated time and then knowing the number of processes the WU is requesting compared with those available from the system, it could perform a simple division and produce a more accurate result for MT WU's as well. Don't know for sure, just speculating but I do have the BOINC source code and might take a look and see if I can find the ETC stuff. Might be interseting. | |
| ID: 58936 | Rating: 0 | rate:
| |
|
Keith Myers Send message Joined: 13 Dec 17 Posts: 1313 Credit: 6,016,967,459 RAC: 9,922,728 Level Scientific publications | |
|
The server code for determining the ETC for MT tasks also has to account for task scheduling. | |
| ID: 58937 | Rating: 0 | rate:
| |
|
STARBASEn Send message Joined: 17 Feb 09 Posts: 91 Credit: 1,603,303,394 RAC: 0 Level Scientific publications | |
|
You make a good point regarding the server side issues. Perhaps the projects themselves, if not already, would submit desired resources to allow the server to compare with those available on clients similar to submitting in house cluster jobs. I also agree that it is probably best to go through BOINC git and get a request for a potential fix but I also want to see their ETC algorithms just out of curiousity, both server and client. Nice interesting discussion. | |
| ID: 58943 | Rating: 0 | rate:
| |
|
Keith Myers Send message Joined: 13 Dec 17 Posts: 1313 Credit: 6,016,967,459 RAC: 9,922,728 Level Scientific publications | |
|
You need to review the code in the /client/work_fetch.cpp module and any of the old closed issues pertaining to use of max_concurrent statements in app_config.xml. | |
| ID: 58944 | Rating: 0 | rate:
| |
|
STARBASEn Send message Joined: 17 Feb 09 Posts: 91 Credit: 1,603,303,394 RAC: 0 Level Scientific publications | |
|
Thank you Keith, much appreciated background and starting points. | |
| ID: 58949 | Rating: 0 | rate:
| |
|
Erich56 Send message Joined: 1 Jan 15 Posts: 1105 Credit: 7,822,620,176 RAC: 1,815,365 Level Scientific publications | |
|
need advice with regard to running Python on one of my Windows machines: | |
| ID: 58961 | Rating: 0 | rate:
| |
|
Richard Haselgrove Send message Joined: 11 Jul 09 Posts: 1589 Credit: 6,676,344,351 RAC: 9,081,515 Level Scientific publications | |
BOINC event log says that some 22GB more RAM are needed. Could you post the exact text of the log message and a few lines either side for context? We might be able to decode it. | |
| ID: 58962 | Rating: 0 | rate:
| |
|
Erich56 Send message Joined: 1 Jan 15 Posts: 1105 Credit: 7,822,620,176 RAC: 1,815,365 Level Scientific publications | |
BOINC event log says that some 22GB more RAM are needed. here is the text of the log message: 26.06.2022 09:20:35 | GPUGRID | Requesting new tasks for CPU and NVIDIA GPU 26.06.2022 09:20:37 | GPUGRID | Scheduler request completed: got 0 new tasks 26.06.2022 09:20:37 | GPUGRID | No tasks sent 26.06.2022 09:20:37 | GPUGRID | No tasks are available for ACEMD 3: molecular dynamics simulations for GPUs 26.06.2022 09:20:37 | GPUGRID | Nachricht vom Server: Python apps for GPU hosts needs 22396.05MB more disk space. You currently have 10982.55 MB available and it needs 33378.60 MB. 26.06.2022 09:20:37 | GPUGRID | Project requested delay of 31 seconds the reason why at this point it says I have 10.982MB available is because I currently have some LHC projects running which use some RAM. However, it also says: I need 33.378MB RAM; so my 32GB RAM are not enough anyway (as seen on the other machine, on which I also have 32GB RAM, and there is no problem with downloading and crunching Python). What I am surprised about is that the projects request so much free RAM, alhough while in operation, it uses only between 1.3 and 5GB. | |
| ID: 58963 | Rating: 0 | rate:
| |
|
Richard Haselgrove Send message Joined: 11 Jul 09 Posts: 1589 Credit: 6,676,344,351 RAC: 9,081,515 Level Scientific publications | |
26.06.2022 09:20:37 | GPUGRID | Nachricht vom Server: Python apps for GPU hosts needs 22396.05MB more disk space. You currently have 10982.55 MB available and it needs 33378.60 MB. Disk, not RAM. Probably one or other of your disk settings is blocking it. | |
| ID: 58964 | Rating: 0 | rate:
| |
|
Erich56 Send message Joined: 1 Jan 15 Posts: 1105 Credit: 7,822,620,176 RAC: 1,815,365 Level Scientific publications | |
26.06.2022 09:20:37 | GPUGRID | Nachricht vom Server: Python apps for GPU hosts needs 22396.05MB more disk space. You currently have 10982.55 MB available and it needs 33378.60 MB. Oh sorry, you are perfectly right. My mistake, how dumm :-( so, with my 32GB Ramdisk it does not work, when it says that it needs 33378MB. What I could do, theoretically, is to shift BOINC from the Ramdisk to the 1 GB SSD. However, the reason why I installed BOINC on the Ramdisk was that the LHC Atlas tasks which I am crunching permanently have an enormous disk usage, and I don't want ATLAS to kill the SSD too early. I guess that there might be ways to install a second instance of BOINC on the SSD - I tried this on another PC years ago, but somehow I did not get it done properly :-( | |
| ID: 58965 | Rating: 0 | rate:
| |
|
Richard Haselgrove Send message Joined: 11 Jul 09 Posts: 1589 Credit: 6,676,344,351 RAC: 9,081,515 Level Scientific publications | |
|
You'll need to decide which copy of BOINC is going to be your 'primary' installation (default settings, autorun stuff in the registry, etc.), and which is going to be the 'secondary'. <allow_multiple_clients>1</allow_multiple_clients> to the options section of cc_config.xml (or set the value to 1 if the line is already present). That needs a client restart if BOINC's already running. Then, these two batch files work for me. Adapt program and data locations as needed. To run the client: D:\BOINC\rh_boinc_test --allow_multiple_clients --allow_remote_gui_rpc --redirectio --detach_console --gui_rpc_port 31418 --dir D:\BOINCdata2\ To run a Manager to control the second client: start D:\BOINC\boincmgr.exe /m /n 127.0.0.1 /g 31418 /p password Note that I've set this up to run test clients alongside my main working installation - you can probably ignore that bit. | |
| ID: 58966 | Rating: 0 | rate:
| |
|
Jim1348 Send message Joined: 28 Jul 12 Posts: 819 Credit: 1,591,285,971 RAC: 0 Level Scientific publications | |
We have a time estimation problem, discussed previously in the thread. As Keith mentioned, the real walltime calculation should be much less than reported. Are you still in need of that? My first Python ran for 12 hours 55 minutes according to BoincTasks, but the website reported 156,269.60 seconds (over 43 hours). It got 75,000 credits. http://www.gpugrid.net/results.php?hostid=593715 | |
| ID: 58968 | Rating: 0 | rate:
| |
|
abouh Project administrator Project developer Project tester Project scientist Send message Joined: 31 May 21 Posts: 200 Credit: 0 RAC: 0 Level Scientific publications | |
|
Thanks for the feedback Jim1348! It is useful for us to confirm that jobs run in a reasonable time despite the wrong estimation issue. Maybe that can be solved somehow in the future. Seems like at least did no estimate dozens of days like I have seen in other occasions. | |
| ID: 58969 | Rating: 0 | rate:
| |
|
Ian&Steve C. Send message Joined: 21 Feb 20 Posts: 1048 Credit: 40,228,383,983 RAC: 547,485 Level Scientific publications | |
|
it's because the app is using the CPU time instead of runtime. since it uses so many threads, it adds up the time spent on all the threads. 2 threads working for 1hr total would be 2hrs reported CPU time. you need to track wall clock time. the app seems to have this capability since it reports timestamps of start and stop in the stderr.txt file. | |
| ID: 58970 | Rating: 0 | rate:
| |
|
Richard Haselgrove Send message Joined: 11 Jul 09 Posts: 1589 Credit: 6,676,344,351 RAC: 9,081,515 Level Scientific publications | |
|
There are two separate problems with timing. | |
| ID: 58971 | Rating: 0 | rate:
| |
|
Ian&Steve C. Send message Joined: 21 Feb 20 Posts: 1048 Credit: 40,228,383,983 RAC: 547,485 Level Scientific publications | |
that may be true, NOW. however, if they move to a dynamic credit scheme (as they should) that awards credit based on flops and runtime (like ACEMD3 does), then the runtime will not be just cosmetic. ____________ | |
| ID: 58972 | Rating: 0 | rate:
| |
|
Richard Haselgrove Send message Joined: 11 Jul 09 Posts: 1589 Credit: 6,676,344,351 RAC: 9,081,515 Level Scientific publications | |
|
OK, I got one on host 508381. Initial estimate is 752d 05:26:18, task is 32940037 | |
| ID: 58973 | Rating: 0 | rate:
| |
|
Richard Haselgrove Send message Joined: 11 Jul 09 Posts: 1589 Credit: 6,676,344,351 RAC: 9,081,515 Level Scientific publications | |
|
Yesterday's task is just in the final stages - it'll finish after about 13 hours - and the next is ready to start. So here are the figures for the next in the cycle. | |
| ID: 58974 | Rating: 0 | rate:
| |
|
roundup Send message Joined: 11 May 10 Posts: 60 Credit: 2,901,505,193 RAC: 39,106,109 Level Scientific publications | |
|
The credits per runtime for cuda1131 really looks strange sometimes: | |
| ID: 58975 | Rating: 0 | rate:
| |
|
abouh Project administrator Project developer Project tester Project scientist Send message Joined: 31 May 21 Posts: 200 Credit: 0 RAC: 0 Level Scientific publications | |
|
Yes, you are right about that. There are 2 types of experiments I run now: | |
| ID: 58977 | Rating: 0 | rate:
| |
|
abouh Project administrator Project developer Project tester Project scientist Send message Joined: 31 May 21 Posts: 200 Credit: 0 RAC: 0 Level Scientific publications | |
|
The credit system gives 50.000 credits per task. However, completion before a certain amount of time multiplies this value by 1.5, then by 1.25 for a while and finally by 1.0 indefinitely. That explains why sometimes you see 75.000 and sometimes 62.500 credits. | |
| ID: 58978 | Rating: 0 | rate:
| |
|
Toby Broom Send message Joined: 11 Dec 08 Posts: 25 Credit: 360,187,443 RAC: 11 Level Scientific publications | |
|
I had a idea after reading some of the post about utilisation of resources. | |
| ID: 58979 | Rating: 0 | rate:
| |
|
abouh Project administrator Project developer Project tester Project scientist Send message Joined: 31 May 21 Posts: 200 Credit: 0 RAC: 0 Level Scientific publications | |
|
The reason Reinforcement Learning agents do not currently use the whole potential of the cards is because the interactions between the AI agent and the simulated environment are performed on CPU while the agent "learning" process is the one that uses the GPU intermittently. | |
| ID: 58980 | Rating: 0 | rate:
| |
|
Toby Broom Send message Joined: 11 Dec 08 Posts: 25 Credit: 360,187,443 RAC: 11 Level Scientific publications | |
|
Thanks for the comments, what about using large quantity of VRAM if available, the latest BOINC finally allows for correct reporting VRAM on NVidia cards so you can tailor the WUs based on VRAM to protect the contributions from users with lower specification computers. | |
| ID: 58981 | Rating: 0 | rate:
| |
|
FritzB Send message Joined: 7 Apr 15 Posts: 11 Credit: 2,374,441,100 RAC: 11,247,192 Level Scientific publications | |
|
Sorry for OT, but some people need admin help and I've seen one beeing active here :) | |
| ID: 58995 | Rating: 0 | rate:
| |
|
abouh Project administrator Project developer Project tester Project scientist Send message Joined: 31 May 21 Posts: 200 Credit: 0 RAC: 0 Level Scientific publications | |
|
Hi Fritz! Apparently the problem is that sending emails from server no longer works. I will mention the problem to the server admin. | |
| ID: 59002 | Rating: 0 | rate:
| |
|
abouh Project administrator Project developer Project tester Project scientist Send message Joined: 31 May 21 Posts: 200 Credit: 0 RAC: 0 Level Scientific publications | |
|
I talked to the server admin and he explained to me the problem in more detail. | |
| ID: 59003 | Rating: 0 | rate:
| |
|
abouh Project administrator Project developer Project tester Project scientist Send message Joined: 31 May 21 Posts: 200 Credit: 0 RAC: 0 Level Scientific publications | |
|
Hello Toby, | |
| ID: 59004 | Rating: 0 | rate:
| |
|
Toby Broom Send message Joined: 11 Dec 08 Posts: 25 Credit: 360,187,443 RAC: 11 Level Scientific publications | |
|
BOINC can detect the quantity of GPU memory, it was bugged in the older BOINC version for nVidia cards but in 7.20 its fixed so there would be no need to detect in Python as its already in the project database. | |
| ID: 59006 | Rating: 0 | rate:
| |
|
Even video cards with 6GiB crash with insufficient VRAM. | |
| ID: 59007 | Rating: 0 | rate:
| |
|
jjch Send message Joined: 10 Nov 13 Posts: 98 Credit: 15,429,700,388 RAC: 174,090 Level Scientific publications | |
|
From what we are finding right now the 6GB GPUs would have sufficient VRAM to run the current Python tasks. Refer to this thread noting between 2.5 and 3.2 GB being used:https://www.gpugrid.net/forum_thread.php?id=5327 | |
| ID: 59008 | Rating: 0 | rate:
| |
|
Richard Haselgrove Send message Joined: 11 Jul 09 Posts: 1589 Credit: 6,676,344,351 RAC: 9,081,515 Level Scientific publications | |
|
New generic error on multiple tasks this morning: TypeError: create_factory() got an unexpected keyword argument 'recurrent_nets' Seems to affect the entire batch currently being generated. | |
| ID: 59039 | Rating: 0 | rate:
| |
|
abouh Project administrator Project developer Project tester Project scientist Send message Joined: 31 May 21 Posts: 200 Credit: 0 RAC: 0 Level Scientific publications | |
|
Thanks for letting us know Richard. It is a minor error, sorry for the inconvenience, I am fixing it right now. Unfortunately the remaining jobs of the batch will crash but then will be replaced with correct ones. | |
| ID: 59040 | Rating: 0 | rate:
| |
|
Richard Haselgrove Send message Joined: 11 Jul 09 Posts: 1589 Credit: 6,676,344,351 RAC: 9,081,515 Level Scientific publications | |
|
No worries - these things happen. The machine which alerted me to the problem now has a task 'created 28 Jul 2022 | 10:33:04 UTC' which seems to be running normally. | |
| ID: 59042 | Rating: 0 | rate:
| |
|
abouh Project administrator Project developer Project tester Project scientist Send message Joined: 31 May 21 Posts: 200 Credit: 0 RAC: 0 Level Scientific publications | |
|
Yes exactly, it has to fail 8 times... the only good part is that the bugged tasks fail at the beginning of the script so almost no computation is wasted. I have checked and some of the tasks in the newest batch have already finished successfully. | |
| ID: 59043 | Rating: 0 | rate:
| |
|
robertmiles Send message Joined: 16 Apr 09 Posts: 503 Credit: 740,445,933 RAC: 18,577 Level Scientific publications | |
|
A peculiarity of Python apps for GPU hosts 4.03 (cuda1131): | |
| ID: 59071 | Rating: 0 | rate:
| |
|
Richard Haselgrove Send message Joined: 11 Jul 09 Posts: 1589 Credit: 6,676,344,351 RAC: 9,081,515 Level Scientific publications | |
|
I've been monitoring and playing with the initial runtime estimates for these tasks. | |
| ID: 59076 | Rating: 0 | rate:
| |
|
Ian&Steve C. Send message Joined: 21 Feb 20 Posts: 1048 Credit: 40,228,383,983 RAC: 547,485 Level Scientific publications | |
|
or just use the flops reported by BOINC for the GPU. since it is recorded and communicated to the project. and from my experience (with ACEMD tasks) does get used in the credit reward for the non-static award scheme. so the project is certainly getting it and able to use that value. | |
| ID: 59077 | Rating: 0 | rate:
| |
|
Richard Haselgrove Send message Joined: 11 Jul 09 Posts: 1589 Credit: 6,676,344,351 RAC: 9,081,515 Level Scientific publications | |
|
Except: | |
| ID: 59078 | Rating: 0 | rate:
| |
|
Ian&Steve C. Send message Joined: 21 Feb 20 Posts: 1048 Credit: 40,228,383,983 RAC: 547,485 Level Scientific publications | |
|
personally I'm a big fan of just standardizing the task computational size and assigning static credit. no matter the device used or how long it takes. just take flops out of the equation completely. that way faster devices get more credit/RAC based on the rate in which valid tasks are returned. | |
| ID: 59099 | Rating: 0 | rate:
| |
|
Keith Myers Send message Joined: 13 Dec 17 Posts: 1313 Credit: 6,016,967,459 RAC: 9,922,728 Level Scientific publications | |
|
The latest Python tasks I've done today have awarded 105,000 credits as compared to all the previous tasks at 75,000 credits. | |
| ID: 59101 | Rating: 0 | rate:
| |
|
Jim1348 Send message Joined: 28 Jul 12 Posts: 819 Credit: 1,591,285,971 RAC: 0 Level Scientific publications | |
Anyone notice this new award level? I just got my first one. http://www.gpugrid.net/workunit.php?wuid=27270757 But not all the new ones receive that. A subsequent one received the usual 75,000 credit. | |
| ID: 59102 | Rating: 0 | rate:
| |
|
Keith Myers Send message Joined: 13 Dec 17 Posts: 1313 Credit: 6,016,967,459 RAC: 9,922,728 Level Scientific publications | |
|
Thanks for your report. It doesn't really track with scaling now that I examine my tasks. | |
| ID: 59104 | Rating: 0 | rate:
| |
|
Richard Haselgrove Send message Joined: 11 Jul 09 Posts: 1589 Credit: 6,676,344,351 RAC: 9,081,515 Level Scientific publications | |
|
My first 'high rate' task (105K credits) was a workunit created at 10 Aug 2022 | 2:03:51 UTC. | |
| ID: 59105 | Rating: 0 | rate:
| |
|
Keith Myers Send message Joined: 13 Dec 17 Posts: 1313 Credit: 6,016,967,459 RAC: 9,922,728 Level Scientific publications | |
|
That implies the current release candidates are being assigned 105K credit based I assume on harder to crunch datasets. | |
| ID: 59107 | Rating: 0 | rate:
| |
|
Aurum Send message Joined: 12 Jul 17 Posts: 400 Credit: 13,821,664,882 RAC: 29,957,975 Level Scientific publications | |
|
Which apps are running these days? The apps page is missing the column that shows how much is running: https://www.gpugrid.net/apps.php <app_config> <!-- i9-10980XE 18c36t 32 GB L3 Cache 24.75 MB --> <app> <name>acemd3</name> <plan_class>cuda1121</plan_class> <gpu_versions> <cpu_usage>1.0</cpu_usage> <gpu_usage>1.0</gpu_usage> </gpu_versions> <fraction_done_exact/> </app> <app> <name>acemd4</name> <plan_class>cuda1121</plan_class> <gpu_versions> <cpu_usage>1.0</cpu_usage> <gpu_usage>1.0</gpu_usage> </gpu_versions> <fraction_done_exact/> </app> <app> <name>PythonGPU</name> <plan_class>cuda1121</plan_class> <gpu_versions> <cpu_usage>4.0</cpu_usage> <gpu_usage>1.0</gpu_usage> </gpu_versions> <app_version> <app_name>PythonGPU</app_name> <avg_ncpus>4</avg_ncpus> <ngpus>1</ngpus> <cmdline>--nthreads 4</cmdline> </app_version> <fraction_done_exact/> <max_concurrent>1</max_concurrent> </app> <app> <name>PythonGPUbeta</name> <plan_class>cuda1121</plan_class> <gpu_versions> <cpu_usage>4.0</cpu_usage> <gpu_usage>1.0</gpu_usage> </gpu_versions> <app_version> <app_name>PythonGPU</app_name> <avg_ncpus>4</avg_ncpus> <ngpus>1</ngpus> <cmdline>--nthreads 4</cmdline> </app_version> <fraction_done_exact/> <max_concurrent>1</max_concurrent> </app> <app> <name>Python</name> <plan_class>cuda1121</plan_class> <cpu_usage>4</cpu_usage> <gpu_versions> <cpu_usage>4</cpu_usage> <gpu_usage>1</gpu_usage> </gpu_versions> <app_version> <app_name>PythonGPU</app_name> <avg_ncpus>4</avg_ncpus> <ngpus>1</ngpus> <cmdline>--nthreads 4</cmdline> </app_version> <fraction_done_exact/> <max_concurrent>1</max_concurrent> </app> </app_config> | |
| ID: 59109 | Rating: 0 | rate:
| |
|
Keith Myers Send message Joined: 13 Dec 17 Posts: 1313 Credit: 6,016,967,459 RAC: 9,922,728 Level Scientific publications | |
|
I get away with only reserving 3 cpu threads. That does not impact or affect what the actual task does when it runs. Just BOINC cpu scheduling for other projects. | |
| ID: 59110 | Rating: 0 | rate:
| |
|
[CSF] Aleksey Belkov  Send message Joined: 26 Dec 13 Posts: 85 Credit: 1,229,981,270 RAC: 24,152 Level Scientific publications | |
|
Hi, guys! | |
| ID: 59111 | Rating: 0 | rate:
| |
|
Keith Myers Send message Joined: 13 Dec 17 Posts: 1313 Credit: 6,016,967,459 RAC: 9,922,728 Level Scientific publications | |
Hi, guys! Yes, because of flaws in Windows memory management, that effect cannot be gotten around. You need to increase the size of your pagefile to the 50GB range to be safe. Linux does not have the problem and no changes are necessary to run the tasks. The project primarily develops Linux applications first as the development process is simpler. Then they tackle the difficulties of developing a Windows application with all the necessary workarounds. Just the way it is. For the reason why read this post. https://www.gpugrid.net/forum_thread.php?id=5322&nowrap=true#58908 | |
| ID: 59112 | Rating: 0 | rate:
| |
|
[CSF] Aleksey Belkov Send message Joined: 26 Dec 13 Posts: 85 Credit: 1,229,981,270 RAC: 24,152 Level Scientific publications | |
|
Thank you for clarification. | |
| ID: 59113 | Rating: 0 | rate:
| |
|
Keith Myers Send message Joined: 13 Dec 17 Posts: 1313 Credit: 6,016,967,459 RAC: 9,922,728 Level Scientific publications | |
|
Task credits are fixed. Pay no attention to the running times. BOINC completely mishandles that since it has no recognition of the dual nature of these cpu-gpu application tasks. | |
| ID: 59114 | Rating: 0 | rate:
| |
|
Erich56 Send message Joined: 1 Jan 15 Posts: 1105 Credit: 7,822,620,176 RAC: 1,815,365 Level Scientific publications | |
|
Can anyone tell me what happened to this task: | |
| ID: 59115 | Rating: 0 | rate:
| |
|
Richard Haselgrove Send message Joined: 11 Jul 09 Posts: 1589 Credit: 6,676,344,351 RAC: 9,081,515 Level Scientific publications | |
|
RuntimeError: [enforce fail at ..\c10\core\CPUAllocator.cpp:76] data. DefaultCPUAllocator: not enough memory: you tried to allocate 3612672 bytes. | |
| ID: 59116 | Rating: 0 | rate:
| |
|
Erich56 Send message Joined: 1 Jan 15 Posts: 1105 Credit: 7,822,620,176 RAC: 1,815,365 Level Scientific publications | |
RuntimeError: [enforce fail at ..\c10\core\CPUAllocator.cpp:76] data. DefaultCPUAllocator: not enough memory: you tried to allocate 3612672 bytes. thanks Richard for the quick reply. I now changed the page file size to max. 65MB. I did it on both drives: system drive C:/ and drive F:/ (on separate SSD) on which BOINC is running. Probably to change it for only one drive would have been okay, right? If so, which one? | |
| ID: 59117 | Rating: 0 | rate:
| |
|
Keith Myers Send message Joined: 13 Dec 17 Posts: 1313 Credit: 6,016,967,459 RAC: 9,922,728 Level Scientific publications | |
|
The Windows one. | |
| ID: 59118 | Rating: 0 | rate:
| |
|
Jim1348 Send message Joined: 28 Jul 12 Posts: 819 Credit: 1,591,285,971 RAC: 0 Level Scientific publications | |
|
I am a bit surprised that I am able to run the pythons without problem under Ubuntu 20.04.4 on a GTX 1060. It has 3GB of video memory, and uses 2.8GB thus far. And the CPU is currently running two cores (down from the previous four cores), using about 3.7GB of memory, though reserving 19 GB. | |
| ID: 59119 | Rating: 0 | rate:
| |
|
Erich56 Send message Joined: 1 Jan 15 Posts: 1105 Credit: 7,822,620,176 RAC: 1,815,365 Level Scientific publications | |
The Windows one. thx :-) | |
| ID: 59120 | Rating: 0 | rate:
| |
|
Toby Broom Send message Joined: 11 Dec 08 Posts: 25 Credit: 360,187,443 RAC: 11 Level Scientific publications | |
|
Can the CPU usage be adjusted correctly? its fine to use a number of cores but currently it say less than one and uses more than 1 | |
| ID: 59141 | Rating: 0 | rate:
| |
|
abouh Project administrator Project developer Project tester Project scientist Send message Joined: 31 May 21 Posts: 200 Credit: 0 RAC: 0 Level Scientific publications | |
|
Hello! sorry for the late reply | |
| ID: 59143 | Rating: 0 | rate:
| |
|
abouh Project administrator Project developer Project tester Project scientist Send message Joined: 31 May 21 Posts: 200 Credit: 0 RAC: 0 Level Scientific publications | |
|
current value of rsc_fpops_est is 1e18, with 10e18 as limit. I remember we had to increase it because otherwise produced false “task aborted by host” from some users side. Do you think we should change it again? | |
| ID: 59144 | Rating: 0 | rate:
| |
|
Richard Haselgrove Send message Joined: 11 Jul 09 Posts: 1589 Credit: 6,676,344,351 RAC: 9,081,515 Level Scientific publications | |
Regarding cpu_usage, I remember having this discussion with Toni and I think the reason why we set the number of cores to that number is because with a single core the jobs can actually be executed. Even if they create 32 threads. Definitely do not require 32 cores. Is there an advantage of setting it to an arbitrary number higher than 1? Couldn't that cause some allocation problems? sorry it is a bit outside of my knowledge zone... This is a consequence of the handling of GPU plan_classes in the released BOINC server code. In the raw BOINC code, the cpu_usage value is calculated by some obscure (and, in all honesty, irrelevant and meaningless) calculation of the ratio of the number of flops that will be performed on the CPU and the GPU - the GPU, in particular, being assumed to be processing at an arbitrary fraction of the theoretical peak speed. In short, it's useless. I don't think the raw BOINC code expects you to make manual alterations to the calculated value. If you've found a way of over-riding and fixing it - great. More power to your elbow. The current issue arises because the Python app is neither a pure GPU app, nor a pure multi-threaded CPU app. It operates in both modes - and the BOINC developers didn't think of that. I think you need to create a special, new, plan_class name for this application, and experiment on that. Don't meddle with the existing plan_classes - that will mess up the other GPUGrid lines of research. I'm running with a manual override which devotes the whole GPU power, plus 3 CPUs, to the Python tasks. That seems to work reasonably well: it keeps enough work from other BOINC projects off the CPU while Python is running. | |
| ID: 59145 | Rating: 0 | rate:
| |
|
KAMasud Send message Joined: 27 Jul 11 Posts: 137 Credit: 523,901,354 RAC: 0 Level Scientific publications | |
Regarding cpu_usage, I remember having this discussion with Toni and I think the reason why we set the number of cores to that number is because with a single core the jobs can actually be executed. Even if they create 32 threads. Definitely do not require 32 cores. Is there an advantage of setting it to an arbitrary number higher than 1? Couldn't that cause some allocation problems? sorry it is a bit outside of my knowledge zone... Could you tell us a bit more about this manual override? Just now it is sprawled over five cores, ten threads. If it sees the sixth core free, it grabs that one also. | |
| ID: 59152 | Rating: 0 | rate:
| |
|
Keith Myers Send message Joined: 13 Dec 17 Posts: 1313 Credit: 6,016,967,459 RAC: 9,922,728 Level Scientific publications | |
|
If you run other projects concurrently, then it is adviseable to limit the number of cores the Python tasks occupies for scheduling. I am not talking about the number of threads each task uses since that is fixed. | |
| ID: 59153 | Rating: 0 | rate:
| |
|
KAMasud Send message Joined: 27 Jul 11 Posts: 137 Credit: 523,901,354 RAC: 0 Level Scientific publications | |
If you run other projects concurrently, then it is adviseable to limit the number of cores the Python tasks occupies for scheduling. I am not talking about the number of threads each task uses since that is fixed. Thank you Keith. Why is it using so many cores plus is it something like OpenIFS on CPDN? | |
| ID: 59154 | Rating: 0 | rate:
| |
|
Richard Haselgrove Send message Joined: 11 Jul 09 Posts: 1589 Credit: 6,676,344,351 RAC: 9,081,515 Level Scientific publications | |
Thank you Keith. Why is it using so many cores plus is it something like OpenIFS on CPDN? Yes - or nbody at MilkyWay. This Python task shares characteristics of a cuda (GPU) plan class, and a MT (multithreaded) plan class, and works best if treated as such. | |
| ID: 59155 | Rating: 0 | rate:
| |
|
Richard Haselgrove Send message Joined: 11 Jul 09 Posts: 1589 Credit: 6,676,344,351 RAC: 9,081,515 Level Scientific publications | |
|
Possible bad workunit: 27278732 ValueError: Expected value argument (Tensor of shape (1024,)) to be within the support (IntegerInterval(lower_bound=0, upper_bound=17)) of the distribution Categorical(logits: torch.Size([1024, 18])), but found invalid values: | |
| ID: 59163 | Rating: 0 | rate:
| |
|
abouh Project administrator Project developer Project tester Project scientist Send message Joined: 31 May 21 Posts: 200 Credit: 0 RAC: 0 Level Scientific publications | |
|
Interesting I had never seen this error before, thank you! | |
| ID: 59178 | Rating: 0 | rate:
| |
|
Toby Broom Send message Joined: 11 Dec 08 Posts: 25 Credit: 360,187,443 RAC: 11 Level Scientific publications | |
|
Thanks Richard, is 3 CPU cores enough to not slow down the GPU? | |
| ID: 59192 | Rating: 0 | rate:
| |
|
Ian&Steve C. Send message Joined: 21 Feb 20 Posts: 1048 Credit: 40,228,383,983 RAC: 547,485 Level Scientific publications | |
|
I'm noticing an interesting difference in application behavior between different systems. abouh, can you help explain the reason? | |
| ID: 59203 | Rating: 0 | rate:
| |
|
Ian&Steve C. Send message Joined: 21 Feb 20 Posts: 1048 Credit: 40,228,383,983 RAC: 547,485 Level Scientific publications | |
|
or perhaps the Broadwell based Intel CPU is able to hardware accelerate some tasks that the EPYC has to do in software, leading to higher CPU use? | |
| ID: 59204 | Rating: 0 | rate:
| |
|
abouh Project administrator Project developer Project tester Project scientist Send message Joined: 31 May 21 Posts: 200 Credit: 0 RAC: 0 Level Scientific publications | |
|
The application is not coded in any specific way to force more work to be done on more modern processors. | |
| ID: 59205 | Rating: 0 | rate:
| |
|
Ian&Steve C. Send message Joined: 21 Feb 20 Posts: 1048 Credit: 40,228,383,983 RAC: 547,485 Level Scientific publications | |
Maybe python handles it under the hood somehow? it might be related to pytorch actually. I did some more digging and it seems like AMD has worse performance due to some kind of CPU detection issue in the MKL (or maybe deliberate by Intel). do you know what version of MKL your package uses? and are you able to set specific env variables in your package? if your MKL is version <=2020.0, setting MKL_DEBUG_CPU_TYPE=5 might help this issue on AMD CPUs. but it looks like this will not be effective if you are on a newer version of the MKL as Intel has since removed this variable. ____________ | |
| ID: 59206 | Rating: 0 | rate:
| |
|
Ian&Steve C. Send message Joined: 21 Feb 20 Posts: 1048 Credit: 40,228,383,983 RAC: 547,485 Level Scientific publications | |
to add: I was able to inspect your MKL version as 2019.0.4, and I tried setting the env variable by adding os.environ["MKL_DEBUG_CPU_TYPE"] = "5" to the run.py main program, but it had no effect. either I didn't put the command in the right place (I inserted it below line 433 in the run.py script), or the issue is something else entirely. edit: you also might consider compiling your scripts into binaries to prevent inquisitive minds from messing about in your program ;) ____________ | |
| ID: 59207 | Rating: 0 | rate:
| |
|
Keith Myers Send message Joined: 13 Dec 17 Posts: 1313 Credit: 6,016,967,459 RAC: 9,922,728 Level Scientific publications | |
|
Should the environment variable for fixing AMD computation in the MKL library be in the task package or just in the host environment? Or both? | |
| ID: 59208 | Rating: 0 | rate:
| |
|
Ian&Steve C. Send message Joined: 21 Feb 20 Posts: 1048 Credit: 40,228,383,983 RAC: 547,485 Level Scientific publications | |
|
I didn’t explicitly state it in my previous reply. But I tried all that already and it didn’t make any difference. I even ran run.py standalone outside of BOINC to be sure that the env variable was set. Neither the env variable being set nor the fake Intel library made any difference at all. | |
| ID: 59209 | Rating: 0 | rate:
| |
|
Keith Myers Send message Joined: 13 Dec 17 Posts: 1313 Credit: 6,016,967,459 RAC: 9,922,728 Level Scientific publications | |
|
Ohh . . . . OK. Didn't know you had tried all the previous existing fixes. | |
| ID: 59210 | Rating: 0 | rate:
| |
|
abouh Project administrator Project developer Project tester Project scientist Send message Joined: 31 May 21 Posts: 200 Credit: 0 RAC: 0 Level Scientific publications | |
|
I could definitely set the env variable depending on package version in my scripts if that made AI agents train faster. | |
| ID: 59211 | Rating: 0 | rate:
| |
|
Keith Myers Send message Joined: 13 Dec 17 Posts: 1313 Credit: 6,016,967,459 RAC: 9,922,728 Level Scientific publications | |
|
Don't know if the math functions being used by the Python libraries are any higher than SSE2 or not. | |
| ID: 59212 | Rating: 0 | rate:
| |
|
Ian&Steve C. Send message Joined: 21 Feb 20 Posts: 1048 Credit: 40,228,383,983 RAC: 547,485 Level Scientific publications | |
I could definitely set the env variable depending on package version in my scripts if that made AI agents train faster. Was my location for the variable in the script right or appropriate? inserted below line 433. Does the script inherit the OS variables already? Just wanted to make sure I had it set properly. I figured the script runs in its own environment outside of BOINC (in Python). That’s why I tried adding it to the script. ____________ | |
| ID: 59213 | Rating: 0 | rate:
| |
|
Ian&Steve C. Send message Joined: 21 Feb 20 Posts: 1048 Credit: 40,228,383,983 RAC: 547,485 Level Scientific publications | |
It’s hard to say whether it’s faster or not since it’s not a true apples to apples comparison. So far it feels not faster, but that’s against different CPUs and different GPUs. Maybe my EPYC system seems similarly fast because the EPYC is just brute forcing it. It had much higher IPC than the old Broadwell based Intel. ____________ | |
| ID: 59214 | Rating: 0 | rate:
| |
|
Erich56 Send message Joined: 1 Jan 15 Posts: 1105 Credit: 7,822,620,176 RAC: 1,815,365 Level Scientific publications | |
|
One of my machines started a Python task yesterday evening and finished it after about 24-1/ 2hours. | |
| ID: 59215 | Rating: 0 | rate:
| |
|
Ian&Steve C. Send message Joined: 21 Feb 20 Posts: 1048 Credit: 40,228,383,983 RAC: 547,485 Level Scientific publications | |
One of my machines started a Python task yesterday evening and finished it after about 24-1/ 2hours. The calculated runtime is using the cpu time. Has been mentioned many times. It’s because more than one core was being used. So the sum of each core’s cpu time is what’s shown. You did get 48hr bonus of 25%. Base credit is 70,000. You got 87,500 (+25%). Less than 24hrs gets +50% for 105,000. ____________ | |
| ID: 59216 | Rating: 0 | rate:
| |
|
Erich56 Send message Joined: 1 Jan 15 Posts: 1105 Credit: 7,822,620,176 RAC: 1,815,365 Level Scientific publications | |
|
GPUGRID seems to have problems with figures, at least what concerns Python :-( | |
| ID: 59217 | Rating: 0 | rate:
| |
|
Ian&Steve C. Send message Joined: 21 Feb 20 Posts: 1048 Credit: 40,228,383,983 RAC: 547,485 Level Scientific publications | |
GPUGRID seems to have problems with figures, at least what concerns Python :-( probably due to your allocation of disk usage in BOINC. go into the compute preferences and allow BOINC to use more disk space. by default I think it is set to 50% of the disk drive. you might need to increase that. Options-> Computing Preferences... Disk and Memory tab and set whatever limits you think are appropriate. it will use the most restrictive of the 3 types of limits. The Python tasks take up a lot of space. ____________ | |
| ID: 59218 | Rating: 0 | rate:
| |
|
Erich56 Send message Joined: 1 Jan 15 Posts: 1105 Credit: 7,822,620,176 RAC: 1,815,365 Level Scientific publications | |
no, it isn't that. I am aware of these setting. Since nothing else than BOINC is being done on this computer, disk and RAM usage are set to 90% for BOINC. So, when I have some 58GB free on a 128GB RAM disk (with some 60GB free system RAM), it should normally be no problem for Python to download and being processed. On another machine, I have a lot less ressources, and it works. So no idea, what the problem is in this case ... :-( | |
| ID: 59221 | Rating: 0 | rate:
| |
|
Keith Myers Send message Joined: 13 Dec 17 Posts: 1313 Credit: 6,016,967,459 RAC: 9,922,728 Level Scientific publications | |
|
Or BOINC doesn't consider a RAM Disk a "real" drive and ignores the available storage there. | |
| ID: 59222 | Rating: 0 | rate:
| |
|
Erich56 Send message Joined: 1 Jan 15 Posts: 1105 Credit: 7,822,620,176 RAC: 1,815,365 Level Scientific publications | |
Or BOINC doesn't consider a RAM Disk a "real" drive and ignores the available storage there. no, I have BOINC running on another PC with Ramdisk - in that case a much smaller one: 32GB | |
| ID: 59223 | Rating: 0 | rate:
| |
|
Erich56 Send message Joined: 1 Jan 15 Posts: 1105 Credit: 7,822,620,176 RAC: 1,815,365 Level Scientific publications | |
|
another question - | |
| ID: 59224 | Rating: 0 | rate:
| |
|
Keith Myers Send message Joined: 13 Dec 17 Posts: 1313 Credit: 6,016,967,459 RAC: 9,922,728 Level Scientific publications | |
|
No. You cannot alter the task configuration. It will always create 32 spawned processes for each task during computation. | |
| ID: 59225 | Rating: 0 | rate:
| |
|
Erich56 Send message Joined: 1 Jan 15 Posts: 1105 Credit: 7,822,620,176 RAC: 1,815,365 Level Scientific publications | |
... thanks, Keith, for your explanation. Well, I actually would not need to put in this app_config.xml as in my case; the other BOINC tasks don't just asign any number of CPU cores by themselves. I tell each of these projects by a seperate app_config.xml how many cores to use (which I was, in fact, also hoping for Python). So I have no other choice than to live with the situation as is :-( What is too bad though is that obviously there are no longer any ACEMD tasks being sent out (where it is basically clear: 1 task = 1 CPU core [unless changed by an app_config.xml]). | |
| ID: 59226 | Rating: 0 | rate:
| |
|
Erich56 Send message Joined: 1 Jan 15 Posts: 1105 Credit: 7,822,620,176 RAC: 1,815,365 Level Scientific publications | |
Or BOINC doesn't consider a RAM Disk a "real" drive and ignores the available storage there. Now I tried once more to download a Python on my system with a 128GB Ramdisk (plus 128GB system RAM). The BOINC event log says: Python apps for GPU hosts needs 4590.46MB more disk space. You currently have 28788.14 MB available and it needs 33378.60 MB. Somehow though all this does not fit together: in reality, the Ramdisk is filled with 73GB and has 55GB available. Further, I am questioning whether Python indeed needs 33.378 MB free disk space for downloading? I am really frustrated that this does not work :-( | |
| ID: 59228 | Rating: 0 | rate:
| |
|
Keith Myers Send message Joined: 13 Dec 17 Posts: 1313 Credit: 6,016,967,459 RAC: 9,922,728 Level Scientific publications | |
... You are not understanding the nature of the Python tasks. They are not using all your cores. They are not using 32 cores. They are using 32 spawned processes A process is NOT a core. The Python task use from 100-300% of a cpu core depending on the speed of the host and the number of cores in the host. That is why I offered the app_config.xml file to allot 3 cpu cores to each Python task for BOINC scheduling purposes. And you can have many app_config.xml files in play among all your projects as a app_config file is specific to each project and is placed into the projects folder. You certainly can use one for scheduling help for GPUGrid. A app_config file does not control the number of cores a task uses. That is dependent soley on the science application. A task will use as many or as little cores as needed. The only exception to that fact is in the special case of plan_class MT like the cpu tasks at Milkyway. Then BOINC has an actual control parameter --nthreads that can specifically set the number of cores allowed in the MT plan_class task. That cannot be used here because the Python tasks are not a simple cpu only MT type task. They are something completely different and something that BOINC does not know how to handle. They are a dual cpu-gpu combination task where the majority of computation is done on a cpu with bursts of activity on a gpu and then computation repeats that action. It would take a major rewrite of core BOINC code to properly handle this type of machine-learning, reinforcement learning combo tasks. Unless BOINC attracts new developers that are willing to tackle this major development hurdle, the best we can do is just accommodate these tasks through other host controls. | |
| ID: 59229 | Rating: 0 | rate:
| |
|
Keith Myers Send message Joined: 13 Dec 17 Posts: 1313 Credit: 6,016,967,459 RAC: 9,922,728 Level Scientific publications | |
|
Make sure there are NO checkmarks on any selection in the Disk and memory tab of the BOINC Manager Options >> Computing Preferences page. | |
| ID: 59230 | Rating: 0 | rate:
| |
|
Erich56 Send message Joined: 1 Jan 15 Posts: 1105 Credit: 7,822,620,176 RAC: 1,815,365 Level Scientific publications | |
Make sure there are NO checkmarks on any selection in the Disk and memory tab of the BOINC Manager Options >> Computing Preferences page. I had removed these checkmarks already before. What I did now was to stop new Rosetta tasks (which also need a lot of disk space for their VM files), so the free disk space climbed up to about 80GB - only then the Python download worked. Strange, isn't it? | |
| ID: 59231 | Rating: 0 | rate:
| |
|
Ian&Steve C. Send message Joined: 21 Feb 20 Posts: 1048 Credit: 40,228,383,983 RAC: 547,485 Level Scientific publications | |
The reason Reinforcement Learning agents do not currently use the whole potential of the cards is because the interactions between the AI agent and the simulated environment are performed on CPU while the agent "learning" process is the one that uses the GPU intermittently. a suggestion for whenever you're able to move to to pure GPU work. PLEASE look into and enable "automatic mixed precision" in your code. https://pytorch.org/docs/stable/notes/amp_examples.html this should greatly benefit those devices which have Tensor cores. to speed things up. ____________ | |
| ID: 59232 | Rating: 0 | rate:
| |
|
Keith Myers Send message Joined: 13 Dec 17 Posts: 1313 Credit: 6,016,967,459 RAC: 9,922,728 Level Scientific publications | |
Make sure there are NO checkmarks on any selection in the Disk and memory tab of the BOINC Manager Options >> Computing Preferences page. I think your issue is your use of a fixed ram disk size instead of a dynamic pagefile that is allowed to grow larger as needed. | |
| ID: 59233 | Rating: 0 | rate:
| |
|
Erich56 Send message Joined: 1 Jan 15 Posts: 1105 Credit: 7,822,620,176 RAC: 1,815,365 Level Scientific publications | |
Make sure there are NO checkmarks on any selection in the Disk and memory tab of the BOINC Manager Options >> Computing Preferences page. I just noticed the same problem with Rosetta Python tasks. So this may be in some kind of relation with the Python architecture. Also in the Rosetta case, the actual disk space available was significantly higher than Rosetta said it would need. So I don't believe that this has anything to do with the fixed ram disk size. What is the logic behind your assumption? | |
| ID: 59234 | Rating: 0 | rate:
| |
|
Keith Myers Send message Joined: 13 Dec 17 Posts: 1313 Credit: 6,016,967,459 RAC: 9,922,728 Level Scientific publications | |
|
If you read the through the various posts, including mine, or investigate the issues with Pytorch on Windows, it is because of the nature of how Windows handles reservation of memory addresses compared to how Linux handles that. | |
| ID: 59235 | Rating: 0 | rate:
| |
|
Erich56 Send message Joined: 1 Jan 15 Posts: 1105 Credit: 7,822,620,176 RAC: 1,815,365 Level Scientific publications | |
So the best method to satisfy this fact on Windows is to start with a 35GB minimum size pagefile with a 50GB maximum size and allow the pagefile to size dynamically between that range. Your fixed ram disk size just isn't flexible enough or large enough apparently. That pagefile size seems to be sufficient for the other Windows users I have assisted with these tasks. thanks for the hint, I will adapt the page file size accordingly and see what happens. | |
| ID: 59236 | Rating: 0 | rate:
| |
|
abouh Project administrator Project developer Project tester Project scientist Send message Joined: 31 May 21 Posts: 200 Credit: 0 RAC: 0 Level Scientific publications | |
|
Not sure if it would have made a difference, but I would have placed your code before line 433, only after importing os and sys | |
| ID: 59237 | Rating: 0 | rate:
| |
|
Ian&Steve C. Send message Joined: 21 Feb 20 Posts: 1048 Credit: 40,228,383,983 RAC: 547,485 Level Scientific publications | |
Not sure if it would have made a difference, but I would have placed your code before line 433, only after importing os and sys thanks :) I'll try anyway edit - nope, no different. ____________ | |
| ID: 59238 | Rating: 0 | rate:
| |
|
Ian&Steve C. Send message Joined: 21 Feb 20 Posts: 1048 Credit: 40,228,383,983 RAC: 547,485 Level Scientific publications | |
|
really unfortunate to use so much more resources on AMD than Intel. It's something about the multithreaded nature of the main run.py process itself. on intel it uses about 2-5% per process, and more run.py processes spin up the more cores you have. with AMD, it uses like 20-40% per process, so with high core count CPUs, that makes total CPU utilization crazy high. | |
| ID: 59239 | Rating: 0 | rate:
| |
|
Diplomat Send message Joined: 1 Sep 10 Posts: 15 Credit: 621,049,648 RAC: 675 Level Scientific publications | |
No. You cannot alter the task configuration. It will always create 32 spawned processes for each task during computation. does it improve GPU utilization? on average I see barely 20% with seldom spikes up to 35% | |
| ID: 59240 | Rating: 0 | rate:
| |
|
Ian&Steve C. Send message Joined: 21 Feb 20 Posts: 1048 Credit: 40,228,383,983 RAC: 547,485 Level Scientific publications | |
does it improve GPU utilization? on average I see barely 20% with seldom spikes up to 35% not directly. but if your GPU is being bottlenecked by not enough CPU resources then it could help. the best configuration so far is to not run ANY other CPU or GPU work. run only these tasks, and run 2 at a time to occupy a little more GPU. ____________ | |
| ID: 59241 | Rating: 0 | rate:
| |
|
gemini8 Send message Joined: 3 Jul 16 Posts: 31 Credit: 1,573,937,676 RAC: 5,287,655 Level Scientific publications | |
|
Hi everyone. the best configuration so far is to not run ANY other CPU or GPU work. run only these tasks, and run 2 at a time to occupy a little more GPU. I'm thinking about putting every other Boinc CPU work into a VM instead of running it directly on the host. You could have a VM using only 90 per cent of processing power through the VM settings. This would leave the rest for the Python stuff, so on a sixteen-thread CPU it could use 160% of one thread's power or 10% of the CPU. If this wasn't enough the VM could be adjusted to only using eighty per cent (320% of one thread's power or 20% of the CPU for the Python work) and so on. Return [adjust and try] until the machine does fine. Plus, you could run other GPU stuff on your GPU to have it fully utilized which should prevent high temperature variations which I see as unnecessary stress for a GPU. MilkyWay has a small VRAM footprint and doesn't use a full GPU, and maybe I'll try WCG OPNG as well. ____________ Greetings, Jens | |
| ID: 59248 | Rating: 0 | rate:
| |
|
Erich56 Send message Joined: 1 Jan 15 Posts: 1105 Credit: 7,822,620,176 RAC: 1,815,365 Level Scientific publications | |
... and maybe I'll try WCG OPNG as well. forget about WCG OPNG for the time being. Most of the time no tasks available; and if tasks are available for a short period of time, it's extremely hard to get them downloaded. The downloads get stuck most of the time, and only manual intervention helps. | |
| ID: 59251 | Rating: 0 | rate:
| |
|
Erich56 Send message Joined: 1 Jan 15 Posts: 1105 Credit: 7,822,620,176 RAC: 1,815,365 Level Scientific publications | |
|
Question: can a running Python task be interrupted for the time a Windows Update takes place (with rebooting of the PC), or does this damage the task? | |
| ID: 59254 | Rating: 0 | rate:
| |
|
Keith Myers Send message Joined: 13 Dec 17 Posts: 1313 Credit: 6,016,967,459 RAC: 9,922,728 Level Scientific publications | |
Question: can a running Python task be interrupted for the time a Windows Update takes place (with rebooting of the PC), or does this damage the task? Yes, one great thing about the Python tasks compared to acemd3 tasks is that they can be interrupted and continue on later with no penalty. They save checkpoints well which are replayed to get the task back to the point in progress it was at before interruption. Just be advised, that the replay process takes a few minutes after restart. The task will show 2% completion percentage upon restart but will eventually jump back to the progress point it was at and continue calculation until end. Just be patient and let the task run. | |
| ID: 59255 | Rating: 0 | rate:
| |
|
Jim1348 Send message Joined: 28 Jul 12 Posts: 819 Credit: 1,591,285,971 RAC: 0 Level Scientific publications | |
Yes, one great thing about the Python tasks compared to acemd3 tasks is that they can be interrupted and continue on later with no penalty. I have a problem that they fail on reboot however. Is that common? http://www.gpugrid.net/results.php?hostid=583702 That is only on Windows though. I have not seen it yet on Linux, but I don't reboot often there. | |
| ID: 59259 | Rating: 0 | rate:
| |
|
Keith Myers Send message Joined: 13 Dec 17 Posts: 1313 Credit: 6,016,967,459 RAC: 9,922,728 Level Scientific publications | |
Yes, one great thing about the Python tasks compared to acemd3 tasks is that they can be interrupted and continue on later with no penalty. Guess it must be only on Windows. No problem restarting a task after a reboot on Ubuntu. | |
| ID: 59260 | Rating: 0 | rate:
| |
|
abouh Project administrator Project developer Project tester Project scientist Send message Joined: 31 May 21 Posts: 200 Credit: 0 RAC: 0 Level Scientific publications | |
|
The restart is supposed to work fine on Windows as well. Could you provide more information about when this error happens please? Does it happen systematically every time you interrupt and try to resume a task? | |
| ID: 59261 | Rating: 0 | rate:
| |
|
Jim1348 Send message Joined: 28 Jul 12 Posts: 819 Credit: 1,591,285,971 RAC: 0 Level Scientific publications | |
Could you provide more information about when this error happens please? Does it happen systematically every time you interrupt and try to resume a task? I can pause and restart them with no problem. The error occurred only on reboot. But I think I have found it. I was using a large write cache, PrimoCache, set with a 8 GB cache size and 1 hour latency. By disabling that, I am able to reboot without a problem. So there was probably a delay in flushing the cache on reboot that caused the error. But I used the write cache to protect my SSD, since I was seeing writes of around 370 GB a day, too much for me. But this time I am seeing only 200 GB/day. That is still a lot, but not fatal for some time. It seems that the work units vary in how much they will write. I will monitor it. I use SsdReady to monitor the writes to disk; the free version is OK. PS - I can set PrimoCache to only a 1 GB write-cache size with a 5 minute latency, and it reboots without a problem. Whether that is good enough to protect the SSD will have to be determined by monitoring the actual writes to disk. PrimoCache gives a measure of that. (SsdReady gives the OS writes, but not the actual writes to disk.) PPS: I should point out that the reason a write cache can cut down on the writes to disk is because of the nature of scientific algorithms. They invariable read from a location, do a calculation, and then write back to the same location much of the time. Then, the cache can store that, and only write to the disk the changes that occur at the end of the flush period. If you have a large enough cache, and set the write-delay to infinite, you essentially have a ramdisk. But the cache can be good enough, with less memory than a ramdisk would require. (And now it seems that 2 GB and 10 minutes works OK.) | |
| ID: 59262 | Rating: 0 | rate:
| |
|
Erich56 Send message Joined: 1 Jan 15 Posts: 1105 Credit: 7,822,620,176 RAC: 1,815,365 Level Scientific publications | |
|
Question for the experts here: | |
| ID: 59265 | Rating: 0 | rate:
| |
|
Ian&Steve C. Send message Joined: 21 Feb 20 Posts: 1048 Credit: 40,228,383,983 RAC: 547,485 Level Scientific publications | |
|
Sorry. There is no way to configure an app_config to differentiate between devices. | |
| ID: 59266 | Rating: 0 | rate:
| |
|
Erich56 Send message Joined: 1 Jan 15 Posts: 1105 Credit: 7,822,620,176 RAC: 1,815,365 Level Scientific publications | |
Sorry. There is no way to configure an app_config to differentiate between devices. In fact, I have 2 BOINC clients on this PC; I had to establish the second one with the BOINC DataDir on the SSD, since the first one is on the 32GB Ramdisk which would not let download Python tasks ("not enough disk space"). However, next week I will double the RAM on this PC, from 64 to 128GB, and then I will increase the Ramdisk size to at least 64GB; this should make it possible to download Python - at least that' what I hope. So then I could run 1 Python on each of the 2 GPUs on the SSD client, and a third Python on the Ramdisk client. The only two questions now are: how do I tell the Ramdisk client to run only 1 Python (although 2 GPUs available)? And how do I tell the Ramdisk client to choose the GPU with the lower amount of VRAM usage (i.e. the one that's NOT running the display)? In fact, I would prefer to run 2 Pythons on the Ramdisk client and 1 Python on the SSD client; however, the question is whether I could download 2 Pythons on the 64GB Ramdisk - the only thing I could do is to try. | |
| ID: 59267 | Rating: 0 | rate:
| |
|
Ian&Steve C. Send message Joined: 21 Feb 20 Posts: 1048 Credit: 40,228,383,983 RAC: 547,485 Level Scientific publications | |
|
please read the BOINC documentation for client configuration. all of the options and what they do are in there. | |
| ID: 59268 | Rating: 0 | rate:
| |
|
Ian&Steve C. Send message Joined: 21 Feb 20 Posts: 1048 Credit: 40,228,383,983 RAC: 547,485 Level Scientific publications | |
|
personally I would stop running the ram disk. it's just extra complication and eats up ram space that the Python tasks crave. your biggest benefit will be moving to linux, it's easily 2x faster, maybe more. I don't know how you have your systems set up, but i see your longest runtimes on your 3070 are like 24hrs. that's crazy long. are you not leaving enough CPU available? are you running other CPU work at the same time? | |
| ID: 59269 | Rating: 0 | rate:
| |
|
Erich56 Send message Joined: 1 Jan 15 Posts: 1105 Credit: 7,822,620,176 RAC: 1,815,365 Level Scientific publications | |
... thanks very much for your hints:-) One other thing that I now noticed when reading the stderr of the 3 Pythons that failed short time after start: "RuntimeError: [enforce fail at C:\cb\pytorch_1000000000000\work\c10\core\impl\alloc_cpu.cpp:81] data. DefaultCPUAllocator: not enough memory: you tried to allocate 3612672 bytes" So the reason why the tasks crashed after a few seconds was not the too small VRAM (this would probably have come up a little later), but the lack of system RAM. In fact, I remember that right after start of the 4 Pythons, the Meminfo tool showed a rapid decrease of free system RAM, and shortly thereafter the free RAM was going up again (i.e. after 3 tasks had crashed thus releasing memory). Any idea how mugh system RAM, roughly, a Python task takes? | |
| ID: 59270 | Rating: 0 | rate:
| |
|
Erich56 Send message Joined: 1 Jan 15 Posts: 1105 Credit: 7,822,620,176 RAC: 1,815,365 Level Scientific publications | |
From what I can see in the Windows Task Manager on this PC and on others running Python tasks, RAM usage of a Python can be from about 1GB to 6GB (!) How come that it varies that much? | |
| ID: 59271 | Rating: 0 | rate:
| |
|
Ian&Steve C. Send message Joined: 21 Feb 20 Posts: 1048 Credit: 40,228,383,983 RAC: 547,485 Level Scientific publications | |
|
you should figure 7-8GB per python task. that's what it seems to use on my linux system. i would imagine it uses a little when the task starts up, then slowly increases once it gets to running full out. that might be the reason for the variance of 1GB in the beginning, and 6+GB by the time it gets to running the main program. | |
| ID: 59272 | Rating: 0 | rate:
| |
|
Erich56 Send message Joined: 1 Jan 15 Posts: 1105 Credit: 7,822,620,176 RAC: 1,815,365 Level Scientific publications | |
|
Erich56 asked: Question: can a running Python task be interrupted for the time a Windows Update takes place (with rebooting of the PC), or does this damage the task? I tried it now - the two tasks running on a RTX3070 each - on Windows - did not survive a reboot :-( | |
| ID: 59280 | Rating: 0 | rate:
| |
|
Erich56 Send message Joined: 1 Jan 15 Posts: 1105 Credit: 7,822,620,176 RAC: 1,815,365 Level Scientific publications | |
|
since yesterday I upgraded the RAM of one of my PCs from 64GB to 128GB (so now I have a 64GB Ramdisk plus 64GB system RAM, before it was half each), every GPUGRID Python fails on this PC with 2 RTX3070 inside. | |
| ID: 59281 | Rating: 0 | rate:
| |
|
Diplomat Send message Joined: 1 Sep 10 Posts: 15 Credit: 621,049,648 RAC: 675 Level Scientific publications | |
I'm new to config editing :) a few more questions Do I need to be more specific in <name> tag and put full application name like Python apps for GPU hosts 4.03 (cuda1131) from task properties? Because I don't see 3 CPUs been given to the task after client restart Application Python apps for GPU hosts 4.03 (cuda1131) Name e00015a03227-ABOU_rnd_ppod_expand_demos25-0-1-RND8538 State Running Received Tue 20 Sep 2022 10:48:34 PM +05 Report deadline Sun 25 Sep 2022 10:48:34 PM +05 Resources 0.99 CPUs + 1 NVIDIA GPU Estimated computation size 1,000,000,000 GFLOPs CPU time 00:48:32 CPU time since checkpoint 00:00:07 Elapsed time 00:11:37 Estimated time remaining 50d 21:42:09 Fraction done 1.990% Virtual memory size 18.16 GB Working set size 5.88 GB Directory slots/8 Process ID 5555 Progress rate 6.840% per hour Executable wrapper_26198_x86_64-pc-linux-gnu | |
| ID: 59285 | Rating: 0 | rate:
| |
|
KAMasud Send message Joined: 27 Jul 11 Posts: 137 Credit: 523,901,354 RAC: 0 Level Scientific publications | |
Yes, one great thing about the Python tasks compared to acemd3 tasks is that they can be interrupted and continue on later with no penalty. The restart works fine on Windows. Maybe, it might be the five-minute break at 2% which might be causing the confusion. | |
| ID: 59286 | Rating: 0 | rate:
| |
|
Keith Myers Send message Joined: 13 Dec 17 Posts: 1313 Credit: 6,016,967,459 RAC: 9,922,728 Level Scientific publications | |
Get rid of the ram disk. | |
| ID: 59287 | Rating: 0 | rate:
| |
|
Keith Myers Send message Joined: 13 Dec 17 Posts: 1313 Credit: 6,016,967,459 RAC: 9,922,728 Level Scientific publications | |
Any already downloaded task will see the original cpu-gpu resource assignment. Any newly downloaded task will show the NEW task assignment. The name for the tasks is PythonGPU as you show. You should always refer to the client_state.xml file as it is the final arbiter of the correct naming and task configuation. | |
| ID: 59288 | Rating: 0 | rate:
| |
|
Keith Myers Send message Joined: 13 Dec 17 Posts: 1313 Credit: 6,016,967,459 RAC: 9,922,728 Level Scientific publications | |
Yes, one great thing about the Python tasks compared to acemd3 tasks is that they can be interrupted and continue on later with no penalty. If you interrupt the task in its Stage 1 of downloading and unpacking the required support files, it may fail on Windows upon restart. It normally shows the failure for this reason in the stderr.txt. Best to interrupt the task once it is actually calculating and after its setup and has produced at least one checkpoint. | |
| ID: 59289 | Rating: 0 | rate:
| |
|
Erich56 Send message Joined: 1 Jan 15 Posts: 1105 Credit: 7,822,620,176 RAC: 1,815,365 Level Scientific publications | |
on the other hand, ramdisk works perfectly on this machine: https://www.gpugrid.net/show_host_detail.php?hostid=599484 | |
| ID: 59290 | Rating: 0 | rate:
| |
|
Keith Myers Send message Joined: 13 Dec 17 Posts: 1313 Credit: 6,016,967,459 RAC: 9,922,728 Level Scientific publications | |
Then you need to investigate the differences between the two hosts. All I'm stating is that the RAM disk is an unnecessary complication that is not needed to process the tasks. Basic troubleshooting. Reduce to the most basic, absolute needed configuration for the tasks to complete correctly and then add back in one extra superfluous element at a time until the tasks fail again. Then you have identified why the tasks fail. | |
| ID: 59291 | Rating: 0 | rate:
| |
|
Diplomat Send message Joined: 1 Sep 10 Posts: 15 Credit: 621,049,648 RAC: 675 Level Scientific publications | |
|
Keith Myers thanks! | |
| ID: 59292 | Rating: 0 | rate:
| |
|
Diplomat Send message Joined: 1 Sep 10 Posts: 15 Credit: 621,049,648 RAC: 675 Level Scientific publications | |
|
In my case config didn't want to work until I added <max_concurrent> <app_config> <app> <name>PythonGPU</name> <max_concurrent>1</max_concurrent> <gpu_versions> <gpu_usage>1.0</gpu_usage> <cpu_usage>3.0</cpu_usage> </gpu_versions> </app> </app_config> Now I see as expected status: Running (3 CPUs + 1 NVIDIA GPU) Unfortunately it doesn't help to get high GPU utilization/ Completion time it looks like gonna be slightly better though | |
| ID: 59293 | Rating: 0 | rate:
| |
|
Keith Myers Send message Joined: 13 Dec 17 Posts: 1313 Credit: 6,016,967,459 RAC: 9,922,728 Level Scientific publications | |
In my case config didn't want to work until I added <max_concurrent> If you have enough cpu for support and enough VRAM on the card, you can get better gpu utilization by moving to 2X tasks on the card. Just change the gpu_usage to 0.5 | |
| ID: 59294 | Rating: 0 | rate:
| |
|
Erich56 Send message Joined: 1 Jan 15 Posts: 1105 Credit: 7,822,620,176 RAC: 1,815,365 Level Scientific publications | |
I installed a RAMdisk because quite often I am crunching tasks which write many GB of data on the disk. E.g. LHC-Atlas, the GPU tasks from WCG, the Pythons from Rosetta, and last not least the Pythons from GPUGRID: about 200GB within 24 hours, which is much (so for my two RTX3070, this would be 400GB/day). So, if the machines are running 24/7, in my opinion this is simply not good for a SSD lifetime. Over the years, my experience with RAMdisk has been a good one. No idea what kind of problem the GPUGRID Pythons have with this particular RAMDisk - or vice versa. As said, on another machine with RAMDisk I also have 2 Pythons running concurrently, even on one GPU, and it works fine. So what I did yesterday evening was letting only one of two RTX3070 crunch a Python. On the other GPU, I sometimes crunched WCG of nothing at all. This evening, after about 22-1/2 hours, the Python finished successfully :-) BTW - beside the Python, 3 ATLAS tasks 3 cores ea. were also running all the time. Which means. what I know so far is that obviously I can run Pythons at least on one of the two RTX3070, and other projects on the other one. Still I will try to further investigate why GPUGRID Pythons don't run on both RTX3070. | |
| ID: 59297 | Rating: 0 | rate:
| |
|
[CSF] Aleksey Belkov Send message Joined: 26 Dec 13 Posts: 85 Credit: 1,229,981,270 RAC: 24,152 Level Scientific publications | |
|
I do not know how to properly mention the project administrators in the topic in order to draw attention to the problem of non-optimal use of disk space by this application. 7za x "X:\BOINC\projects\www.gpugrid.net\pythongpu_windows_x86_64__cuda1131.tar.gz.1a152f102cdad20f16638f0f269a5a17" -so | 7za x -aoa -si -ttar -o"X:\BOINC\slots\0\" Project tar.gz >> app files (5,46 GiB) = 5,46 GiB ! Moreover, if you use for archive not tar.gz format, but 7z (LZMA2 + "5 - Normal" profile, which is the default for recent 7-zip versions), then you can not only seriously save the amount of data downloaded by each user (and as a consequence the bandwidth of project's infrastructure), but speed up the process of unpacking data from archive. Saving more than one GiB:  On my computer, unpacking by pipelining(as mentioned above) using the current(12 years old) 7za version(9.20) takes ~100 seconds. And when using the recent version of 7za(22.01) only ~ 45-50 seconds. 7za x "X:\BOINC\projects\www.gpugrid.net\pythongpu_windows_x86_64__cuda1131.7z" -o"X:\BOINC\slots\0\" I believe that the result of the described changes is worth implementing them (even if not all and/or not at once). Moreover, all changes are reduced only to updating one executable file, repacking the archive and changing the command to unpack it. | |
| ID: 59307 | Rating: 0 | rate:
| |
|
Keith Myers Send message Joined: 13 Dec 17 Posts: 1313 Credit: 6,016,967,459 RAC: 9,922,728 Level Scientific publications | |
|
I believe the researcher has already been down this road with Windows not natively supporting the compression/decompression algorithms you mention. | |
| ID: 59308 | Rating: 0 | rate:
| |
|
[CSF] Aleksey Belkov Send message Joined: 26 Dec 13 Posts: 85 Credit: 1,229,981,270 RAC: 24,152 Level Scientific publications | |
It requires each volunteer to add support manually to their hosts. No Unfortunately, you have inattentively read what I wrote above. It has already been mentioned there that is currently Windows app already comes with 7za.exe version 9.20(you can find it in project folder). So nothing changing. | |
| ID: 59309 | Rating: 0 | rate:
| |
|
Jim1348 Send message Joined: 28 Jul 12 Posts: 819 Credit: 1,591,285,971 RAC: 0 Level Scientific publications | |
|
Yes, I do have GPUGrid installed on my Win10 machine after all. | |
| ID: 59310 | Rating: 0 | rate:
| |
|
Keith Myers Send message Joined: 13 Dec 17 Posts: 1313 Credit: 6,016,967,459 RAC: 9,922,728 Level Scientific publications | |
It requires each volunteer to add support manually to their hosts. OK, so you can thank Richard Haselgrove for the application to now package that utility. Originally, the tasks failed because Windows does not come with that utility and Richard helped debug the issue with the developer. If you think the application is not using the utility correctly you should inform the developer of your analysis and code fix so that other Windows users can benefit. | |
| ID: 59311 | Rating: 0 | rate:
| |
|
[CSF] Aleksey Belkov Send message Joined: 26 Dec 13 Posts: 85 Credit: 1,229,981,270 RAC: 24,152 Level Scientific publications | |
you should inform the developer of your analysis and code fix so that other Windows users can benefit. I have already sent abouh PM to this tread, just in case. | |
| ID: 59312 | Rating: 0 | rate:
| |
|
abouh Project administrator Project developer Project tester Project scientist Send message Joined: 31 May 21 Posts: 200 Credit: 0 RAC: 0 Level Scientific publications | |
|
Hello, thank you very much for your help. I would like to implement the changes if they help optimise the tasks, but let me try to summarise your ideas to see if I got them right: 7za x "X:\BOINC\projects\www.gpugrid.net\pythongpu_windows_x86_64__cuda1131.tar.gz.1a152f102cdad20f16638f0f269a5a17" -so | 7za x -aoa -si -ttar Change C --> Finally, you suggest using .7z encryption instead of .tar.gz to save memory and unpacking time with a more recent version of 7za. Is all the above correct? I believe these changes are worth implementing, thank you very much. I will try to start with Change A and Change B and unroll them into PythonGPUbeta first to test them this week. ____________ | |
| ID: 59335 | Rating: 0 | rate:
| |
|
Richard Haselgrove Send message Joined: 11 Jul 09 Posts: 1589 Credit: 6,676,344,351 RAC: 9,081,515 Level Scientific publications | |
|
Looks good to me. Just one question - are there any 'minimum Windows version' constraints on the later versions of 7za? I think it's unlikely to affect us, but it would be good to check, just in case. | |
| ID: 59336 | Rating: 0 | rate:
| |
|
[CSF] Aleksey Belkov Send message Joined: 26 Dec 13 Posts: 85 Credit: 1,229,981,270 RAC: 24,152 Level Scientific publications | |
|
Hi, abouh!
Of course, if you launch 7za from working directory(/slots/X), than output flag not necessary. Change C You are correct. Using 7z format(LZMA2 compression) significantly reduce archive size, save your bandwidth and some time for unpacking/unzipping process ; ) As I wrote above, the 7za command will be simplified, since the pipelining process will no longer be required. NB! It is important to update the supplied 7za to current version, since version 9.20, a lot of optimizations have been made for compression/decompression of 7z archives(LZMA).
As mentioned on 7-Zip homepage, app support all versions since Windows 2000:
| |
| ID: 59337 | Rating: 0 | rate:
| |
|
abouh Project administrator Project developer Project tester Project scientist Send message Joined: 31 May 21 Posts: 200 Credit: 0 RAC: 0 Level Scientific publications | |
|
As a very first step I am trying to remove the .tar.gz file. I am encountering a first issue. The steps of the jobs are specified in the job.xml file in the following way: <job_desc> Essentially I need to execute a task that removes the pythongpu_windows_x86_64__cuda1131.tar.gz.1a152f102cdad20f16638f0f269a5a17 file after the very first task. When I try in the Windows command prompt: cmd.exe /C "del pythongpu_windows_x86_64__cuda1131.tar.gz.1a152f102cdad20f16638f0f269a5a17" it works. However when I add to the job.xml file <task> The wrapper seems to ignore it. Doesn't the wrapper have cmd.exe? I need to run more tests to figure out the exact command to delete files ____________ | |
| ID: 59340 | Rating: 0 | rate:
| |
|
[CSF] Aleksey Belkov Send message Joined: 26 Dec 13 Posts: 85 Credit: 1,229,981,270 RAC: 24,152 Level Scientific publications | |
<task> Try to use %COMSPEC% variable as alias to %SystemRoot%\system32\cmd.exe If this doesn't work, then I'm sure specifying the full path(C:\Windows\system32\cmd.exe) should work. | |
| ID: 59341 | Rating: 0 | rate:
| |
|
Ian&Steve C. Send message Joined: 21 Feb 20 Posts: 1048 Credit: 40,228,383,983 RAC: 547,485 Level Scientific publications | |
|
in other news. looks like we've finally crunched through all the tasks ready to send. all that remains are the ones in progress and the resends that will come from those. | |
| ID: 59343 | Rating: 0 | rate:
| |
|
abouh Project administrator Project developer Project tester Project scientist Send message Joined: 31 May 21 Posts: 200 Credit: 0 RAC: 0 Level Scientific publications | |
|
True! Specifying the whole path works: <job_desc> I have deployed this Change A into the PythonGPUbeta app, just to test if it works in all Windows machines. Just sent a few (32) jobs. If it works fine on, will move on to introduce the other changes. ____________ | |
| ID: 59347 | Rating: 0 | rate:
| |
|
abouh Project administrator Project developer Project tester Project scientist Send message Joined: 31 May 21 Posts: 200 Credit: 0 RAC: 0 Level Scientific publications | |
|
I will be running new experiments shortly. My idea is to use the whole capacity of the grid. I have already noticed that a few months ago it could absorb around 800 tasks and now it goes up to 1000! Thank you for all the support :) | |
| ID: 59348 | Rating: 0 | rate:
| |
|
abouh Project administrator Project developer Project tester Project scientist Send message Joined: 31 May 21 Posts: 200 Credit: 0 RAC: 0 Level Scientific publications | |
|
The first batch I sent to PythonGPUbeta yesterday failed, but I figured out the problem this morning. I just sent another batch an hour ago to the PythonGPUbeta app. This time seems to be working. It has Change A implemented, so memory usage is more optimised. | |
| ID: 59354 | Rating: 0 | rate:
| |
|
abouh Project administrator Project developer Project tester Project scientist Send message Joined: 31 May 21 Posts: 200 Credit: 0 RAC: 0 Level Scientific publications | |
|
Hello Aleksey! | |
| ID: 59356 | Rating: 0 | rate:
| |
|
Ian&Steve C. Send message Joined: 21 Feb 20 Posts: 1048 Credit: 40,228,383,983 RAC: 547,485 Level Scientific publications | |
|
more tasks? I'm running dry ;) | |
| ID: 59357 | Rating: 0 | rate:
| |
|
Keith Myers Send message Joined: 13 Dec 17 Posts: 1313 Credit: 6,016,967,459 RAC: 9,922,728 Level Scientific publications | |
|
More tasks please, also. | |
| ID: 59358 | Rating: 0 | rate:
| |
|
bibi Send message Joined: 4 May 17 Posts: 14 Credit: 10,617,879,643 RAC: 19,583,410 Level Scientific publications | |
|
Hi, | |
| ID: 59359 | Rating: 0 | rate:
| |
|
[CSF] Aleksey Belkov Send message Joined: 26 Dec 13 Posts: 85 Credit: 1,229,981,270 RAC: 24,152 Level Scientific publications | |
|
Good day, abouh This time seems to be working. It has Change A implemented, It's nice to hear that! Maybe tbz2 or txz? As I understand, tbz2/txz are alias of file extension for tar.bz2/tar.xz. So in fact these formats are tar containers which compressed by bz2 or xz. Therefore, this will require pipelining process, which, however, practically does not affect the unpacking speed, and only lengthens command string. In my test, unpacking of tar.xz done in ~40 seconds. seems like this ones we can unpacked in a single step as well, if recent versions 7za.exe allow to handle this format. xz format supported since version 9.04 beta, but more recent version support multi-threaded (de)compression, witch crucial for fast unpacking. The txz file is substantially smaller but took forever (30 mins) to compress. This format use LZMA2 algorithm, similar as 7z use by default. So space saving must be the same with the same settings(--compress-level). It's highly likely you forgot to use this flag --n-threads <n>, -j <n> to set number of threads to use for compression. By default conda-pack use only 1 thread! And also check --compress-level. Levels higher then 5 not so effective for compression_time/archive_size. Considering how I think that PythonGPU's app file rarely changes, it's not big deal. As far as I remember, this (practically) does not affect unpacking speed. On my test(32 threads / Threadripper 2950X), it took ~2,5 minutes with compress-level 5(archive size 1,55 GiB). | |
| ID: 59360 | Rating: 0 | rate:
| |
|
[CSF] Aleksey Belkov Send message Joined: 26 Dec 13 Posts: 85 Credit: 1,229,981,270 RAC: 24,152 Level Scientific publications | |
why not producing a zip file, because the boinc client can unzip such file direct from the project folder to the slot like with acemd3. You're probably right. I somehow didn't pay attention to acemd3 archives in project directory. Is there some info, how BOINC's work with archives? I suppose boinc-client uses its built-in library to work with archives (zlib ?), rather than some OS functions/tools. There's still a dilemma: 1) On the one hand, using zip format will simplify process of application launching and reduce the amount of disk space required by application (no need to copy archive to the working directory). Amount of written data on disk reduced accordingly. 2) On other hand, xz format reduce archive size by whole GiB, that helps to save project's network bandwidth and time to download necessary files at first users access to project. | |
| ID: 59361 | Rating: 0 | rate:
| |
|
[CSF] Aleksey Belkov Send message Joined: 26 Dec 13 Posts: 85 Credit: 1,229,981,270 RAC: 24,152 Level Scientific publications | |
On my test(32 threads / Threadripper 2950X), it took ~2,5 minutes with compress-level 5(archive size 1,55 GiB). It's about compression* | |
| ID: 59362 | Rating: 0 | rate:
| |
|
abouh Project administrator Project developer Project tester Project scientist Send message Joined: 31 May 21 Posts: 200 Credit: 0 RAC: 0 Level Scientific publications | |
|
We tried to pack files with zip at first but encountered problems in windows. Not sure if it was some kind of strange quirk in the wrapper or in conda-pack (the tool for creating, packing and unpacking conda environments, https://conda.github.io/conda-pack/), but the process failed for compressed environment files above a certain memory size. | |
| ID: 59364 | Rating: 0 | rate:
| |
|
abouh Project administrator Project developer Project tester Project scientist Send message Joined: 31 May 21 Posts: 200 Credit: 0 RAC: 0 Level Scientific publications | |
|
You were absolutely right, I forgot the number of threads! I could now reproduce a a much faster compression as well. | |
| ID: 59365 | Rating: 0 | rate:
| |
|
bibi Send message Joined: 4 May 17 Posts: 14 Credit: 10,617,879,643 RAC: 19,583,410 Level Scientific publications | |
|
Hi abouh, | |
| ID: 59366 | Rating: 0 | rate:
| |
|
bibi Send message Joined: 4 May 17 Posts: 14 Credit: 10,617,879,643 RAC: 19,583,410 Level Scientific publications | |
|
7z.exe calls the dll, 7za.exe stands alone. You find it in 7-Zip Extra on https://7-zip.org/download.html | |
| ID: 59367 | Rating: 0 | rate:
| |
|
[CSF] Aleksey Belkov Send message Joined: 26 Dec 13 Posts: 85 Credit: 1,229,981,270 RAC: 24,152 Level Scientific publications | |
All this has already been discussed by several posts above. If you had read before writing...
I think this is not a good idea. Some antiviruses may perceive an attempt to launch cmd.exe not from the system directory as suspicious/malicious activity. | |
| ID: 59368 | Rating: 0 | rate:
| |
|
abouh Project administrator Project developer Project tester Project scientist Send message Joined: 31 May 21 Posts: 200 Credit: 0 RAC: 0 Level Scientific publications | |
|
I added the discussed changes and deployed them to the PythonGPUbeta app. More specifically: | |
| ID: 59369 | Rating: 0 | rate:
| |
|
Keith Myers Send message Joined: 13 Dec 17 Posts: 1313 Credit: 6,016,967,459 RAC: 9,922,728 Level Scientific publications | |
|
No, I haven't been lucky enough yet to snag any of the beta tasks. | |
| ID: 59370 | Rating: 0 | rate:
| |
|
Richard Haselgrove Send message Joined: 11 Jul 09 Posts: 1589 Credit: 6,676,344,351 RAC: 9,081,515 Level Scientific publications | |
|
One of my Linux machines has just crashed two tasks in succession with UnboundLocalError: local variable 'features' referenced before assignment https://www.gpugrid.net/results.php?hostid=508381 Edit - make that three. And a fourth looks to be heading in the same direction - many other users have tried it already. | |
| ID: 59371 | Rating: 0 | rate:
| |
|
abouh Project administrator Project developer Project tester Project scientist Send message Joined: 31 May 21 Posts: 200 Credit: 0 RAC: 0 Level Scientific publications | |
|
Thanks for the warning Richard, I have just fixed the error. Should not be present in the jobs starting a few minutes from now. | |
| ID: 59372 | Rating: 0 | rate:
| |
|
Richard Haselgrove Send message Joined: 11 Jul 09 Posts: 1589 Credit: 6,676,344,351 RAC: 9,081,515 Level Scientific publications | |
|
Yes, the next one has got well into the work zone - 1.99%. Thank you. | |
| ID: 59373 | Rating: 0 | rate:
| |
|
KAMasud Send message Joined: 27 Jul 11 Posts: 137 Credit: 523,901,354 RAC: 0 Level Scientific publications | |
|
Just an observation. | |
| ID: 59374 | Rating: 0 | rate:
| |
|
Erich56 Send message Joined: 1 Jan 15 Posts: 1105 Credit: 7,822,620,176 RAC: 1,815,365 Level Scientific publications | |
|
I tried to run 1 Python on a second BOINC instance. | |
| ID: 59375 | Rating: 0 | rate:
| |
|
KAMasud Send message Joined: 27 Jul 11 Posts: 137 Credit: 523,901,354 RAC: 0 Level Scientific publications | |
|
My question is, how can 13 tasks run on a 12-thread machine? Is it a good idea to run other tasks? Also, why was Boinc not taking into account the GPUGrid task? | |
| ID: 59376 | Rating: 0 | rate:
| |
|
Richard Haselgrove Send message Joined: 11 Jul 09 Posts: 1589 Credit: 6,676,344,351 RAC: 9,081,515 Level Scientific publications | |
|
If the 13th task is assessed - by the project and BOINC in conjunction - to require less than 1.0000 of a CPU, it will be allowed to run in parallel with a fully occupied CPU. For a GPU task, it will run at a slightly higher CPU priority, so it will steal CPU cycles from the pure CPU tasks - but on a modern multitasking OS, they won't notice the difference. | |
| ID: 59377 | Rating: 0 | rate:
| |
|
Ian&Steve C. Send message Joined: 21 Feb 20 Posts: 1048 Credit: 40,228,383,983 RAC: 547,485 Level Scientific publications | |
I tried to run 1 Python on a second BOINC instance. i think you're trying to do too much at once. 22-24hrs is incredibly slow for a single task on a 3070. my 3060 does them in 13hrs, doing 3 tasks at a time (4.3hrs effective speed). if you want any kind of reasonable performance, you need to stop processing other projects on the same system. or at the very least, adjust your app_config file to reserve more CPU for your Python task to prevent BOINC from running too much extra work from other projects. switch to Linux for even better performance. ____________ | |
| ID: 59379 | Rating: 0 | rate:
| |
|
jjch Send message Joined: 10 Nov 13 Posts: 98 Credit: 15,429,700,388 RAC: 174,090 Level Scientific publications | |
|
Erich56 | |
| ID: 59380 | Rating: 0 | rate:
| |
|
Erich56 Send message Joined: 1 Jan 15 Posts: 1105 Credit: 7,822,620,176 RAC: 1,815,365 Level Scientific publications | |
|
Ian&Steve C. wrote: i think you're trying to do too much at once. 22-24hrs is incredibly slow for a single task on a 3070. my 3060 does them in 13hrs, doing 3 tasks at a time (4.3hrs effective speed). I agree, at the moment it may be "too much at once" :-) FYI, I recently bought another PC with 2 CPUs (8-c/8-HT each) and 1 GPU, I upgraded the RAM from 128GB to 256GB and created a 128GB Ramdisk; and on an existing PC with a 10-c/10-HT CPU plus 2 RTX3070 I upgraded the RAM from 64GB to 128GB (=maximum possible on this MoBo). So no surprise that now I am just testing what's possible. And by doing this, I keep finding out, of course, that sometimes I am expecting too much. What concerns the (low) speed of my two RTX3070: I have always been on the very conservative side what concerns GPU temperatures. Which means I have them run on about 60/61°C, not higher. With two such GPUs inside the same box, heat of course is a topic. Despite of good airflow, in order to keep the GPUs at the above mentioned temperature, I need to throttle them down to about 50-65% (different for each GPU). So this explains for the longer runtimes of the Pythons. If I had to boxes with 1 RTX3070 inside each, I am sure that there would be no need for throtteling. | |
| ID: 59381 | Rating: 0 | rate:
| |
|
Erich56 Send message Joined: 1 Jan 15 Posts: 1105 Credit: 7,822,620,176 RAC: 1,815,365 Level Scientific publications | |
|
jjch wrote: Erich56 thanks for taking your time for dealing with my problem. well, by now it's become clear to me what the cause for failure was: obviously, running a Primegrid GPU task and Python on the same GPU does not work for the Python. After a Primegrid got finished, I started another Python, and it runs well. What concerns memory, you may have misunderstood: when I mentioned the 8GB, I meant to say that I could see in the Windows Task Manager that Python was using 8GB. Total RAM on this machine is 64GB, so more than enough. Also what concerns the swap space: I had set this manually to 100GB min. and 150 GB max., so also more than enough. Again - the problem has been detected anyway. Whereas I had no problem to run two Pythons on the same GPU (even 3 might work), it is NOT possible to have a Python run along with a Primegrid task. So for me, this was a good learning process :-) Again, thanks anyway for your time investigating my failed tasks. | |
| ID: 59382 | Rating: 0 | rate:
| |
|
Erich56 Send message Joined: 1 Jan 15 Posts: 1105 Credit: 7,822,620,176 RAC: 1,815,365 Level Scientific publications | |
|
I just discovered the following problem on the PC which consists of: | |
| ID: 59383 | Rating: 0 | rate:
| |
|
Erich56 Send message Joined: 1 Jan 15 Posts: 1105 Credit: 7,822,620,176 RAC: 1,815,365 Level Scientific publications | |
I just discovered the following problem on the PC which consists of: Meanwhile, the problem has become even worse: After downloading 1 Python, it starts and in the BOINC manager it shows a remaing runtime of about 60 days (!!!). In reality, he task proceeds with normal speed and will be finished within 24 hours, like all other tasks before on this machine. Hence, nothing else can be downoladed. When trying to download tasks from other projects, it shows not requesting tasks: don't need (CPU; NVIDIA GPU: job cache full). when I try to download a second Python, it says "no tasks are available for Python apps for GPU hosts" which is not correct, there are some 150 available for download at the moment. Can anyone give me advice how to get this problem solved? | |
| ID: 59386 | Rating: 0 | rate:
| |
|
Keith Myers Send message Joined: 13 Dec 17 Posts: 1313 Credit: 6,016,967,459 RAC: 9,922,728 Level Scientific publications | |
|
It can't. Due to the dual nature of the python tasks, BOINC has no mechanism to correctly show the estimated time to completion. | |
| ID: 59387 | Rating: 0 | rate:
| |
|
Erich56 Send message Joined: 1 Jan 15 Posts: 1105 Credit: 7,822,620,176 RAC: 1,815,365 Level Scientific publications | |
It can't. Due to the dual nature of the python tasks, BOINC has no mechanism to correctly show the estimated time to completion. But how come that on three other of my systems on which I am running Pythons for a while, the "remaining runtimes" are shown pretty correctly (+/- 24 hours)? And also on the machine in question, up to recently the time was indicated okay. Something must have happened yesterday, but I do not know what. If your assumption was right, on no Boinc instance more than 1 Python could be run in parallel. Didn't you say somewhere here in the forum that you are running 3 Pythons in parallel? How can a second and a third task be downloaded if the first one shows a remaining runtime of 30 or 60 days? What are the remaining runtimes shown for your Pythons once they get started? | |
| ID: 59388 | Rating: 0 | rate:
| |
|
kksplace Send message Joined: 4 Mar 18 Posts: 53 Credit: 1,816,656,749 RAC: 6,127,494 Level Scientific publications | |
|
Let me offer another possible "solution". (I am running two Python tasks on my system.) I found I had to change my Resource Share much, much higher for GPUGrid to effectively share other projects. I originally had Resource shares of 160 for GPUGrid vs 10 for Einstein and 40 for TN-Grid. Since the Python tasks 'use' so much CPU time in particular (at least reported CPU time), it seems to affect the Resource Share calculations at well. I had to move my Resource Share of GPUGrid (for example) to 2,000 to get it both to do two at once and to get Boinc to share with Einstein and TN-Grid roughly the way I wanted. (Nothing magic about my Resource Share ratios; just providing an example of how extreme I went to get it to balance the way I wanted.) | |
| ID: 59389 | Rating: 0 | rate:
| |
|
Keith Myers Send message Joined: 13 Dec 17 Posts: 1313 Credit: 6,016,967,459 RAC: 9,922,728 Level Scientific publications | |
|
No, that was my teammate who is running 3X concurrent on his gpus. | |
| ID: 59390 | Rating: 0 | rate:
| |
|
Erich56 Send message Joined: 1 Jan 15 Posts: 1105 Credit: 7,822,620,176 RAC: 1,815,365 Level Scientific publications | |
Regarding the estimated time to completion, I have not seem them correct on my system yet, though it is getting better. At first Python tasks were starting at 1338 days (!) and now are at 23 days to start. Interesting to hear some of yours are showing correct! What setup are you using in the hosts showing correct times? On one my hosts a new Python started some 25 minutes ago. "Remaining time" is shown as 13 hrs. No particular setup. In the past years, this host had crunched numerous ACEMD tasks. Since a few weeks ago, it's crunching Pythons. GTX980Ti. Besides, 2 "Theory" tasks from LHC are running. | |
| ID: 59391 | Rating: 0 | rate:
| |
|
Erich56 Send message Joined: 1 Jan 15 Posts: 1105 Credit: 7,822,620,176 RAC: 1,815,365 Level Scientific publications | |
|
kksplace wrote: Let me offer another possible "solution". (I am running two Python tasks on my system.) I found I had to change my Resource Share much, much higher for GPUGrid to effectively share other projects. ... well, my target on this machine, in fact, is not to share Pythons with other projects. It would simply make me happy if I could run 2 (or perhaps 3) Pythons simultaneously. The hardware requirements should be sufficient. So, said that, I guess in this case the ressource share would not play any role. BTW: as mentioned before, until some time early last week I did run two Pythons simultaneously on this PC. I have no idea though what the indicated remaining runtimes were. Most probably not that high as now, otherwise I could not have downloaded and started to Pythons in parallel. So any idea what I can do to make this machine run at least 2 Pythons (if not 3) ??? | |
| ID: 59392 | Rating: 0 | rate:
| |
|
kksplace Send message Joined: 4 Mar 18 Posts: 53 Credit: 1,816,656,749 RAC: 6,127,494 Level Scientific publications | |
|
I am limited on any technical knowledge and can only speak how I got mine to work with 2 tasks. Sorry I can't help anymore. As to getting 3 tasks, my understanding from other posts and my own attempt is that you can't without a custom client or some other behind-the-scenes work. The '2 tasks at one time' limit is a GPUGrid restriction somewhere. | |
| ID: 59393 | Rating: 0 | rate:
| |
|
Keith Myers Send message Joined: 13 Dec 17 Posts: 1313 Credit: 6,016,967,459 RAC: 9,922,728 Level Scientific publications | |
|
Yes, the project has a max 2 tasks per gpu limit with project max of 16 tasks. | |
| ID: 59394 | Rating: 0 | rate:
| |
|
Erich56 Send message Joined: 1 Jan 15 Posts: 1105 Credit: 7,822,620,176 RAC: 1,815,365 Level Scientific publications | |
... Keith, just for my understanding: what exactly does the entry <cpu_usage>3.0</cpu_usage> do? | |
| ID: 59395 | Rating: 0 | rate:
| |
|
Ian&Steve C. Send message Joined: 21 Feb 20 Posts: 1048 Credit: 40,228,383,983 RAC: 547,485 Level Scientific publications | |
... Exactly what I said in my previous message. adjust your app_config file to reserve more CPU for your Python task to prevent BOINC from running too much extra work from other projects. What Keith suggested would tell BOINC to reserve 3 whole CPU threads for each running PythonGPU task. ____________ | |
| ID: 59396 | Rating: 0 | rate:
| |
|
abouh Project administrator Project developer Project tester Project scientist Send message Joined: 31 May 21 Posts: 200 Credit: 0 RAC: 0 Level Scientific publications | |
|
Hello! | |
| ID: 59397 | Rating: 0 | rate:
| |
|
Keith Myers Send message Joined: 13 Dec 17 Posts: 1313 Credit: 6,016,967,459 RAC: 9,922,728 Level Scientific publications | |
It tells BOINC to take 3 cpus away from the available resources that BOINC thinks it has to work with. That tells BOINC to not commit resources to other projects that it doesn't have so that you aren't running the cpu overcommitted. It is only for BOINC scheduling of available resources. It does not impact the running of the Python task in any way directly. Only the scientific application itself deteremines how much cpu the task and application will use. You should never run a cpu in overcommitted state because that means that EVERY application including internal housekeeping is constantly fighting for available resources and NONE are running optimally. IOW's . . . . slooooowwwly. You can check your average cpu loading or utilization with the uptime command in the terminal. You should strive to get numbers that are less than the number of cores available to the operating system. If you have a cpu that has 16 cores/32 threads available to the OS, you should strive to use only up to 32 threads over the averaging periods. The uptime command besides printing out how long the system has been up and running also prints out the 1 minute / 5 minute / 15 minute system average loadings. As an example on this AMD 5950X cpu in this daily driver this is my uptime report. keith@Pipsqueek:~$ uptime 00:15:16 up 7 days, 14:41, 1 user, load average: 30.16, 31.76, 32.03 The cpu is right at the limit of maximum utilization of its 32 threads. So I am running it at 100% utilization most of the time. If the averages were higher than 32, then that shows that the cpu is overcommitted and trying to do too much all the time and not running applications efficiently. | |
| ID: 59398 | Rating: 0 | rate:
| |
|
Keith Myers Send message Joined: 13 Dec 17 Posts: 1313 Credit: 6,016,967,459 RAC: 9,922,728 Level Scientific publications | |
|
Thanks for the notice, abouh. Should make the Windows users a bit happier with the experience of crunching your work. | |
| ID: 59399 | Rating: 0 | rate:
| |
|
Erich56 Send message Joined: 1 Jan 15 Posts: 1105 Credit: 7,822,620,176 RAC: 1,815,365 Level Scientific publications | |
thanks, Keith, for the thorough explanation. Now everything is clear to me. What concerns CPU loading/utilization, so far I have been taking a look at the Windows Task Manager which shows a (rough?) percentage on top of the column "CPU". However, for me the question still is how I could get my host with the vast hardware ressources (as described here: https://www.gpugrid.net/forum_thread.php?id=5233&nowrap=true#59383) to run at least 2 Pythons concurrently - as it was the case already before ??? Isn't there a way go get these much too high "remaining time" figures back to real? Or any other way to get more than 1 Python downloaded despite of these high figures? | |
| ID: 59400 | Rating: 0 | rate:
| |
|
Keith Myers Send message Joined: 13 Dec 17 Posts: 1313 Credit: 6,016,967,459 RAC: 9,922,728 Level Scientific publications | |
There isn't any way to get the estimated time remaining down to reasonable values as far as we know without a complete rewrite of the BOINC client code. Or ask @kksplace how he managed to do it. Try to increase your amount of day's cache to 10 and see if you pick up the second task. Are you running with 0.5 gpu_usage via the app_config.xml file exampleI posted? You can spoof 2 gpus being detected by BOINC which would automatically increase your gpu task allowance to 4 tasks. You need to modify the coproc_info.xml file and then lock it down to immutable state so BOINC can't rewrite it. Google spoofing gpus in the Seti and BOINC forums on how to do that. | |
| ID: 59403 | Rating: 0 | rate:
| |
|
Ian&Steve C. Send message Joined: 21 Feb 20 Posts: 1048 Credit: 40,228,383,983 RAC: 547,485 Level Scientific publications | |
Try to increase your amount of day's cache to 10 and see if you pick up the second task. Counterintuitively, this can actually cause the opposite reaction on a lot of projects. if you ask for "too much" work, some projects will just shut you out and tell you that no work is available, even when it is. I don't know why, I just know it happens. this is probably why he can't download work. I would actually recommend keeping this value no larger than 2 days. ____________ | |
| ID: 59404 | Rating: 0 | rate:
| |
|
Keith Myers Send message Joined: 13 Dec 17 Posts: 1313 Credit: 6,016,967,459 RAC: 9,922,728 Level Scientific publications | |
|
I was assuming that GPUGrid was the only project on his host. | |
| ID: 59405 | Rating: 0 | rate:
| |
|
Ian&Steve C. Send message Joined: 21 Feb 20 Posts: 1048 Credit: 40,228,383,983 RAC: 547,485 Level Scientific publications | |
|
I think GPUGRID is one of the projects that reacts negatively to having the value too high. | |
| ID: 59406 | Rating: 0 | rate:
| |
|
Erich56 Send message Joined: 1 Jan 15 Posts: 1105 Credit: 7,822,620,176 RAC: 1,815,365 Level Scientific publications | |
I was assuming that GPUGrid was the only project on his host. at the time I was trying to download and crunch 2 Pythons: YES - no other projects running at that time. Meanwhile, until the problem get's solved, I have running 1 CPU and 1 GPU project on this host. | |
| ID: 59407 | Rating: 0 | rate:
| |
|
[CSF] Aleksey Belkov Send message Joined: 26 Dec 13 Posts: 85 Credit: 1,229,981,270 RAC: 24,152 Level Scientific publications | |
Today I will deploy the changes tested last week in PythonGPUbeta to the PythonGPU app. The changes only affect Windows machines, and should results in downloading smaller initial files, and slightly less memory requirements. Thank you, abouh! Let's try a new tasks :) Now that's probably need to adjust disk space requirements for PythonGPU tasks, isn't it? | |
| ID: 59408 | Rating: 0 | rate:
| |
|
Ian&Steve C. Send message Joined: 21 Feb 20 Posts: 1048 Credit: 40,228,383,983 RAC: 547,485 Level Scientific publications | |
I was assuming that GPUGrid was the only project on his host. even if you solve the problem, you wont get more tasks until you change the GPUGRID task to use 0.5 GPU for 2x. ____________ | |
| ID: 59409 | Rating: 0 | rate:
| |
|
Erich56 Send message Joined: 1 Jan 15 Posts: 1105 Credit: 7,822,620,176 RAC: 1,815,365 Level Scientific publications | |
even if you solve the problem, you wont get more tasks until you change the GPUGRID task to use 0.5 GPU for 2x. this is what I did anyway | |
| ID: 59410 | Rating: 0 | rate:
| |
|
jjch Send message Joined: 10 Nov 13 Posts: 98 Credit: 15,429,700,388 RAC: 174,090 Level Scientific publications | |
|
Good news since the recent changes to the Windows environment. I have seen a great increase of successful tasks. Seems that others have too as my ranking has dropped a bit. | |
| ID: 59414 | Rating: 0 | rate:
| |
|
abouh Project administrator Project developer Project tester Project scientist Send message Joined: 31 May 21 Posts: 200 Credit: 0 RAC: 0 Level Scientific publications | |
|
So good to hear that! | |
| ID: 59416 | Rating: 0 | rate:
| |
|
kotenok2000 Send message Joined: 18 Jul 13 Posts: 78 Credit: 16,175,793 RAC: 9,787 Level Scientific publications | |
|
When i paused workunit and restarted boinc boinc copied pythongpu_windows_x86_64__cuda1131.txz file in slot directory. | |
| ID: 59417 | Rating: 0 | rate:
| |
|
Erich56 Send message Joined: 1 Jan 15 Posts: 1105 Credit: 7,822,620,176 RAC: 1,815,365 Level Scientific publications | |
|
Ian&Steve C. wrote: even if you solve the problem, you wont get more tasks until you change the GPUGRID task to use 0.5 GPU for 2x. as said before, I had done this change in the app_config.xml. After a few days of having had run other projects on this host, I tried again GPUGRID. After all, I got 2 tasks downloaded (although I would have expected 4 since I had tweaked the coproc_info.xml to show 2 GPUs (so obviously this tweak has no effect, for what reason ever). Then, the next disappointment: although 2 Pythons were downloaded, only one started, the other one stayed in "ready to start" status. A view on the status line of the inactive task revealed why so: it says "0.988 CPUs + 1 NVIDIA GPU". Although in the app_config.xml I have set "<gpu_usage>0.5</gpu_usage>". In fact, I am using exactly the same app_config.xml on another host (with less hardware ressources), and there it works - 2 Pythons are crunched simultaneously, the status line of each task says "0.988 CPUs + 0.5 NVIDIA GPUs". FYI, the complete app_config reads as follows: <app_config> <app> <name>PythonGPU</name> <max_concurrent>2</max_concurrent> <gpu_versions> <gpu_usage>0.5</gpu_usage> <cpu_usage>1.0</cpu_usage> </gpu_versions> </app> </app_config> What could be the reason why neither the above mentioned entry in the coproc_info.xml nor the "0.5 GPU" entry in the app_config.xml have the expected effect? I have been using these changes to 0.5 GPU (or even 0.33 and 0.25 GPU - when crunching WCG OPNG tasks) in various projects - it always worked. Why does it not work with GPUGRID on this particular host? This is especially annoying since this host has 2 CPUs and hence would be ideal for crunching 2 Pythons in parallel. Actually, I think that even 3 Pythons would work well (the VRAM of the GPU is 16GB, so no problem from this side). Can anyone give me hints as to what I could do? | |
| ID: 59418 | Rating: 0 | rate:
| |
|
kotenok2000 Send message Joined: 18 Jul 13 Posts: 78 Credit: 16,175,793 RAC: 9,787 Level Scientific publications | |
|
You can reduce hard drive requirement by 1.93 GB if you remove these files from E:\programdata\BOINC\slots\1\Lib\site-packages\torch\lib when windows_fix.py has finished disabling ASLR and making .nv_fatb sections read-only. | |
| ID: 59419 | Rating: 0 | rate:
| |
|
kotenok2000 Send message Joined: 18 Jul 13 Posts: 78 Credit: 16,175,793 RAC: 9,787 Level Scientific publications | |
I just discovered the following problem on the PC which consists of: You can add <fraction_done_exact/> to your app_config.xml | |
| ID: 59420 | Rating: 0 | rate:
| |
|
Ian&Steve C. Send message Joined: 21 Feb 20 Posts: 1048 Credit: 40,228,383,983 RAC: 547,485 Level Scientific publications | |
Ian&Steve C. wrote: several things. first. after changing your app_config file to gpu_usage to 0.5, did you restart boinc or click "read config files" in the Options toolbar menu? you need to do this for any changes in your app_config to take effect. also even if you did click this, tasks downloaded as 1.0 GPU will not change their label to 0.5, but it will be treated as a 0.5 internally. to see this reflected in the task labeling you need to restart boinc. next this line: <max_concurrent>2</max_concurrent> this will prevent more than 2 task from running. even if you download 4, only 2 will run. just letting you know in case this is not what you intended. ____________ | |
| ID: 59421 | Rating: 0 | rate:
| |
|
Erich56 Send message Joined: 1 Jan 15 Posts: 1105 Credit: 7,822,620,176 RAC: 1,815,365 Level Scientific publications | |
several things. after changing an app_config file, I always click "read config files" in the Options toolbar menu. As said before, I have worked with app_config.xml files very often for several years, so I am for sure doing it correctly. I know that tasks downloaded as 1.0 GPU will keep this label. Here, this is not the question though. Because I had set the 0.5 GPU even before I started downloading Pythons. Since then, 5 Pythons were downloaded (3 of them finished and uploaded, 1 active, another one waiting to start), all of them show 1.0 GPU, for unknown reason. I know the meaning of <max_concurrent>2</max_concurrent> thanks for the hint anyway. So, as said before: it's totally unclear to me why in this case the app_config does not work. I see this problem for the first time in all the years :-( What I could still try, after the currently running Python is over, to restart BOINC. Maybe this helps, however, I doubt it. | |
| ID: 59422 | Rating: 0 | rate:
| |
|
Ian&Steve C. Send message Joined: 21 Feb 20 Posts: 1048 Credit: 40,228,383,983 RAC: 547,485 Level Scientific publications | |
|
what does your event log say about your app_config file? maybe you have some whitespace error in it that's causing boinc to not read it properly. when you click read config files, does boinc give any error/warning/complaint about the GPUGRID app_config file? | |
| ID: 59423 | Rating: 0 | rate:
| |
|
Erich56 Send message Joined: 1 Jan 15 Posts: 1105 Credit: 7,822,620,176 RAC: 1,815,365 Level Scientific publications | |
what does your event log say about your app_config file? maybe you have some whitespace error in it that's causing boinc to not read it properly. when you click read config files, does boinc give any error/warning/complaint about the GPUGRID app_config file? I now double- and triple-checked everything you mentioned above. Also, no error/warning/complaint after clicking read config files. So this really is a huge conondrum :-( What I now did was spoofing the GPU count info in the coproc_info.xml, which caused download of total of 4 Pythons, but only 2 running (okay, I want to be modest: 2 better than 1). However, this cannot be the ultimate solution; since the GPU spoofing will have unwanted effects with other GPU projects. So, at the bottom line: no idea what I can yet to to get this app_config work the way it's supposed to. | |
| ID: 59424 | Rating: 0 | rate:
| |
|
Ian&Steve C. Send message Joined: 21 Feb 20 Posts: 1048 Credit: 40,228,383,983 RAC: 547,485 Level Scientific publications | |
|
but what does the event log say? does it claim to find the gpugrid app_config file? what you're describing sounds like BOINC is not reading the file. which can be because there's an error in the file or because you don't have the file in the right location. | |
| ID: 59425 | Rating: 0 | rate:
| |
|
Ian&Steve C. Send message Joined: 21 Feb 20 Posts: 1048 Credit: 40,228,383,983 RAC: 547,485 Level Scientific publications | |
this is exactly what I would expect with the config you've described. 2x GPU spoofed = 4 tasks can download. if you have 2 running on a single GPU, then it's properly using 0.5 per GPU. the only way 2x can run on a single GPU is if the value 0.5 is being used. and only 2 running because of your max_concurrent statement (which you need for the spoofed GPU setup, otherwise it will try to run on the nonexistent second GPU and cause errors). if you want to run 3x on a single GPU now, leave the GPU spoofing in place, change app_config to max_concurrent of 3, and change gpu_usage to 0.33 unless you know how to edit BOINC code and recompile a custom client, you will need to spoof the GPUs to get more tasks to download since the project enforces 2x tasks per GPU. there's no other solution. ____________ | |
| ID: 59426 | Rating: 0 | rate:
| |
|
Erich56 Send message Joined: 1 Jan 15 Posts: 1105 Credit: 7,822,620,176 RAC: 1,815,365 Level Scientific publications | |
but what does the event log say? does it claim to find the gpugrid app_config file? what you're describing sounds like BOINC is not reading the file. which can be because there's an error in the file or because you don't have the file in the right location. sorry I had goofed before. The event log does complain, indeed: 10.10.2022 15:49:42 | GPUGRID | Found app_config.xml 10.10.2022 15:49:42 | GPUGRID | Missing </app> in app_config.xml however, this does not make any sense, because </app> is not missing, is it? <app_config> <app> <name>PythonGPU</name> <fraction_done_exact> <max_concurrent>3</max_concurrent> <gpu_versions> <gpu_usage>0.5</gpu_usage> <cpu_usage>1.0</cpu_usage> </gpu_versions> </app> </app_config> (I had added the <fraction_done_exact> meanwhile) As already said, this is exactly the same app which I use on another host, and there it works. I copied it. And yes, the file is contained in the GPUGRID project folder. | |
| ID: 59427 | Rating: 0 | rate:
| |
|
Ian&Steve C. Send message Joined: 21 Feb 20 Posts: 1048 Credit: 40,228,383,983 RAC: 547,485 Level Scientific publications | |
|
the line <fraction_done_exact> is not right. that's breaking your file. | |
| ID: 59428 | Rating: 0 | rate:
| |
|
Erich56 Send message Joined: 1 Jan 15 Posts: 1105 Credit: 7,822,620,176 RAC: 1,815,365 Level Scientific publications | |
the line <fraction_done_exact> is not right. that's breaking your file. OMG, shame on me :-( Many thanks for your valuable help. What I am questioning is how this error can happen by copying the file from another host (on which everything works fine). Of course, it would have helped if the entry in the event log would have been a little clearer, it was referring to something else. But anyway, the mistake was clearly on my side, and thanks again for your patience :-) BTW, now 3 Pythons are running concurrently. Still, the load on the Quadro P5000 is moderate, the load on the 2 Xeon E5 is 100% each. I will have to observe whether it would'nt make more sense to run 2 Pythons only. | |
| ID: 59429 | Rating: 0 | rate:
| |
|
[CSF] Aleksey Belkov Send message Joined: 26 Dec 13 Posts: 85 Credit: 1,229,981,270 RAC: 24,152 Level Scientific publications | |
|
Good day, abouh ".\7za.exe" x pythongpu_windows_x86_64__cuda1131.txz -y ".\7za.exe" x pythongpu_windows_x86_64__cuda1131.tar -y Is there any problem with implementing pipelined unpacking process? | |
| ID: 59430 | Rating: 0 | rate:
| |
|
Keith Myers Send message Joined: 13 Dec 17 Posts: 1313 Credit: 6,016,967,459 RAC: 9,922,728 Level Scientific publications | |
|
The app_config.xml code you posted is not valid as proclaimed by the XML validator. | |
| ID: 59431 | Rating: 0 | rate:
| |
|
Richard Haselgrove Send message Joined: 11 Jul 09 Posts: 1589 Credit: 6,676,344,351 RAC: 9,081,515 Level Scientific publications | |
|
And you shouldn't have a mid-line break, as shown in line 10. | |
| ID: 59432 | Rating: 0 | rate:
| |
|
KAMasud Send message Joined: 27 Jul 11 Posts: 137 Credit: 523,901,354 RAC: 0 Level Scientific publications | |
|
We, "Boincers" are like cows. If there are no WU's. we move on to greener pastures. Forget about running several WU's on one GPU, give my GPU's something to run. | |
| ID: 59435 | Rating: 0 | rate:
| |
|
Erich56 Send message Joined: 1 Jan 15 Posts: 1105 Credit: 7,822,620,176 RAC: 1,815,365 Level Scientific publications | |
You should always check your syntax of your XML files at the validator. Thanks, Keith, for the link. to be frank, I didn't know that such a validator exists. | |
| ID: 59436 | Rating: 0 | rate:
| |
|
Keith Myers Send message Joined: 13 Dec 17 Posts: 1313 Credit: 6,016,967,459 RAC: 9,922,728 Level Scientific publications | |
|
Been around and published since early Seti days when we all had to do a lot of XML writing for custom app_info's and app_config's | |
| ID: 59437 | Rating: 0 | rate:
| |
|
kotenok2000 Send message Joined: 18 Jul 13 Posts: 78 Credit: 16,175,793 RAC: 9,787 Level Scientific publications | |
|
You can run something like this cd e:\Program Files\BOINC e: :loop TIMEOUT /T 10 boinccmd.exe --project https://www.gpugrid.net update TIMEOUT /T 120 goto loop or write something like that for bash. | |
| ID: 59438 | Rating: 0 | rate:
| |
|
Ian&Steve C. Send message Joined: 21 Feb 20 Posts: 1048 Credit: 40,228,383,983 RAC: 547,485 Level Scientific publications | |
|
hey abouh, | |
| ID: 59439 | Rating: 0 | rate:
| |
|
Erich56 Send message Joined: 1 Jan 15 Posts: 1105 Credit: 7,822,620,176 RAC: 1,815,365 Level Scientific publications | |
|
I notice a big difference in VRAM use between various Python tasks and/or systems, eg: | |
| ID: 59440 | Rating: 0 | rate:
| |
|
abouh Project administrator Project developer Project tester Project scientist Send message Joined: 31 May 21 Posts: 200 Credit: 0 RAC: 0 Level Scientific publications | |
|
Hello Aleksey, <task> And this is the command that should work right? 7za x "X:\BOINC\projects\www.gpugrid.net\pythongpu_windows_x86_64__cuda1131.txz.1a152f102cdad20f16638f0f269a5a17" -so | 7za x -aoa -si -ttar Isn't it actually using 7za 2 times? After some testing, the conclusion I arrived to is that in principle it actually requires 2 BOINC tasks to do it, because 7za decompresses .txz to .tar, and then .tar to plain files. The only way to do it in one task would be to compress the files into a format that 7za can decompress in a single call (like zip, but we already discussed that ziped filed are too big). Does anyone know is that reasoning is correct? can BOINC wrappers execute commands like the one Aleksey suggested? ____________ | |
| ID: 59441 | Rating: 0 | rate:
| |
|
abouh Project administrator Project developer Project tester Project scientist Send message Joined: 31 May 21 Posts: 200 Credit: 0 RAC: 0 Level Scientific publications | |
|
Hello, of course, let me explain | |
| ID: 59442 | Rating: 0 | rate:
| |
|
kotenok2000 Send message Joined: 18 Jul 13 Posts: 78 Credit: 16,175,793 RAC: 9,787 Level Scientific publications | |
|
Each task patches several dlls to disable ASLR and make .nv_fatb sections read-only and leaves 1.93 GB of backup files. | |
| ID: 59443 | Rating: 0 | rate:
| |
|
Ian&Steve C. Send message Joined: 21 Feb 20 Posts: 1048 Credit: 40,228,383,983 RAC: 547,485 Level Scientific publications | |
I notice a big difference in VRAM use between various Python tasks and/or systems, eg: more powerful GPUs will use more VRAM than less powerful GPUs, it scales roughly with core count of the GPU. so a 3090 would use more VRAM than say a 1050Ti on the same exact task. it's just the way it works when the GPU sets up the task, if the task has to scale to 10,000 cores instead of 2,000, it needs to use more memory. ____________ | |
| ID: 59444 | Rating: 0 | rate:
| |
|
Erich56 Send message Joined: 1 Jan 15 Posts: 1105 Credit: 7,822,620,176 RAC: 1,815,365 Level Scientific publications | |
more powerful GPUs will use more VRAM than less powerful GPUs, it scales roughly with core count of the GPU. okay, I see. Many thanks for explaining :-) One thing here that's a pitty is that the GPU with the largest VRAM (Quadro P5000: 16GB) has the lowest number of cores (2.560) :-( But, as so many times: one cannot have everything in life :-) | |
| ID: 59445 | Rating: 0 | rate:
| |
|
kotenok2000 Send message Joined: 18 Jul 13 Posts: 78 Credit: 16,175,793 RAC: 9,787 Level Scientific publications | |
|
Is here anyone with NVIDIA A100 80GB? | |
| ID: 59446 | Rating: 0 | rate:
| |
|
Ian&Steve C. Send message Joined: 21 Feb 20 Posts: 1048 Credit: 40,228,383,983 RAC: 547,485 Level Scientific publications | |
Is here anyone with NVIDIA A100 80GB? only those with $10,000 to spare to use for free on DC. so likely no one ;) lol faster GPUs don't provide much benefit for these tasks since they are so CPU bound. sure there's a lot of VRAM on this card, and maybe you could theoretically spin up 10-15 tasks on a single card, but unless you have A LOT of CPU power and bandwidth to feed it, you're gonna hit another bottleneck before you can hope to benefit from running that many tasks. just 6x tasks maxes out my EPYC 7443P 48 threads @ 3.9GHz. maybe in the future the project can get these tasks to the point where they lean more on the GPU tensor cores and a more GPU only environment, but for now it's mostly a CPU environment with a small contribution by the GPU. ____________ | |
| ID: 59447 | Rating: 0 | rate:
| |
|
Erich56 Send message Joined: 1 Jan 15 Posts: 1105 Credit: 7,822,620,176 RAC: 1,815,365 Level Scientific publications | |
|
just wanted to download another Python task, but BOINC event log tells me the following: | |
| ID: 59449 | Rating: 0 | rate:
| |
|
[CSF] Aleksey Belkov Send message Joined: 26 Dec 13 Posts: 85 Credit: 1,229,981,270 RAC: 24,152 Level Scientific publications | |
Check my previous post about space usage at PythonGPU startup stage. Previously: tar.gz >> slotX (2,66 GiB) >> tar (5,48 GiB) >> app files (~8,13 GiB) = 16,27 GiB (Since archives(tar.gz & tar) were not deleted). Now, after implementation of some improvements, at peak, consumption is about 13,61 GiB, and then(after startup stage) ~8,13 GiB. In any case, it seems to require adjustment. | |
| ID: 59450 | Rating: 0 | rate:
| |
|
Erich56 Send message Joined: 1 Jan 15 Posts: 1105 Credit: 7,822,620,176 RAC: 1,815,365 Level Scientific publications | |
In any case, it seems to require adjustment. I agree | |
| ID: 59451 | Rating: 0 | rate:
| |
|
[CSF] Aleksey Belkov Send message Joined: 26 Dec 13 Posts: 85 Credit: 1,229,981,270 RAC: 24,152 Level Scientific publications | |
Yeah, it seems you are right. Try use this: <task> <application>C:\Windows\System32\cmd.exe</application> <command_line>/C ".\7za.exe x pythongpu_windows_x86_64__cuda1131.txz -so | .\7za.exe x -aoa -si -ttar"</command_line> </task> | |
| ID: 59452 | Rating: 0 | rate:
| |
|
abouh Project administrator Project developer Project tester Project scientist Send message Joined: 31 May 21 Posts: 200 Credit: 0 RAC: 0 Level Scientific publications | |
|
Patching seemed to be required to run so many threads with pytorchrl as these jobs do. Otherwise windows used a lot of memory for every new thread. The script that does the patching is relatively fast. So doing it locally would not save a lot of time. | |
| ID: 59453 | Rating: 0 | rate:
| |
|
abouh Project administrator Project developer Project tester Project scientist Send message Joined: 31 May 21 Posts: 200 Credit: 0 RAC: 0 Level Scientific publications | |
|
Does anyone know if these requirements are estimated by BOINC and adjusted over time like completion time? or if manual adjustment is required? | |
| ID: 59454 | Rating: 0 | rate:
| |
|
Ian&Steve C. Send message Joined: 21 Feb 20 Posts: 1048 Credit: 40,228,383,983 RAC: 547,485 Level Scientific publications | |
|
my runtime estimates have come down to basically reasonable and real levels now. so i think it will adjust on its own over time. | |
| ID: 59455 | Rating: 0 | rate:
| |
|
Richard Haselgrove Send message Joined: 11 Jul 09 Posts: 1589 Credit: 6,676,344,351 RAC: 9,081,515 Level Scientific publications | |
|
abouh's message 59454 was in response to a question about disk storage requirements. No, they won't adjust themselves over time: the amount of disk space required by the task is set by the server, and the amount available to the client is calculated from readings taken of the current state of the host computer. They will only change if the user adjusts the hardware or BOINC client options, or the project staff adjust the job specifications passed to the workunit generator. | |
| ID: 59456 | Rating: 0 | rate:
| |
|
kotenok2000 Send message Joined: 18 Jul 13 Posts: 78 Credit: 16,175,793 RAC: 9,787 Level Scientific publications | |
|
What can this output mean? Update 464, num samples collected 118784, FPS 344 Algorithm: loss 0.1224, value_loss 0.0002, ivalue_loss 0.0113, rnd_loss 0.0307, action_loss 0.0846, entropy_loss 0.0043, mean_intrinsic_rewards 0.0421, min_intrinsic_rewards 0.0084, max_intrinsic_rewards 0.1857, mean_embed_dist 0.0000, max_embed_dist 0.0000, min_embed_dist 0.0000, min_external_reward 0.0000 Episodes: TrainReward 0.0000, l 360.6000, t 649.8340, UnclippedReward 0.0000, VisitedRooms 1.0000 REWARD DEMOS 25, INTRINSIC DEMOS 25, RHO 0.05, PHI 0.05, REWARD THRESHOLD 0.0, MAX DEMO REWARD -inf, INTRINSIC THRESHOLD 1000 FRAMES TO AVOID: 0 Update 465, num samples collected 122880, FPS 347 Algorithm: loss 0.1329, value_loss 0.0002, ivalue_loss 0.0098, rnd_loss 0.0317, action_loss 0.0955, entropy_loss 0.0043, mean_intrinsic_rewards 0.0414, min_intrinsic_rewards 0.0082, max_intrinsic_rewards 0.1516, mean_embed_dist 0.0000, max_embed_dist 0.0000, min_embed_dist 0.0000, min_external_reward 0.0000 Episodes: TrainReward 0.0000, l 341.3529, t 658.7952, UnclippedReward 0.0000, VisitedRooms 1.00000 | |
| ID: 59457 | Rating: 0 | rate:
| |
|
Keith Myers Send message Joined: 13 Dec 17 Posts: 1313 Credit: 6,016,967,459 RAC: 9,922,728 Level Scientific publications | |
|
Nothing of any meaning or consequence for you. Pertinent only to the researcher. | |
| ID: 59458 | Rating: 0 | rate:
| |
|
abouh Project administrator Project developer Project tester Project scientist Send message Joined: 31 May 21 Posts: 200 Credit: 0 RAC: 0 Level Scientific publications | |
|
These are just the logs of the algorithm, printing out the relevant metrics during agent training. | |
| ID: 59459 | Rating: 0 | rate:
| |
|
Erich56 Send message Joined: 1 Jan 15 Posts: 1105 Credit: 7,822,620,176 RAC: 1,815,365 Level Scientific publications | |
|
I now have had 5 tasks in a row which failed after some 2.100 secs, one after the other, within about half an hour. | |
| ID: 59460 | Rating: 0 | rate:
| |
|
bozz4science Send message Joined: 22 May 20 Posts: 109 Credit: 68,936,176 RAC: 0 Level Scientific publications | |
|
I have seen continiously failed tasks starting today. According to the stderr_txt file I reckon there might be at least two, possibly related, errors. File "C:\ProgramData\BOINC\slots\5\python_dependencies\buffer.py", line 794, in insert_transition
| |
| ID: 59461 | Rating: 0 | rate:
| |
|
Erich56 Send message Joined: 1 Jan 15 Posts: 1105 Credit: 7,822,620,176 RAC: 1,815,365 Level Scientific publications | |
*KeyError: 'StateEmbeddings' exactly same thing I notice on all my failed tasks. | |
| ID: 59462 | Rating: 0 | rate:
| |
|
Same here. | |
| ID: 59463 | Rating: 0 | rate:
| |
|
mrchips Send message Joined: 9 May 21 Posts: 13 Credit: 965,805,500 RAC: 168,040 Level Scientific publications | |
|
my latest WU end with a computation error | |
| ID: 59464 | Rating: 0 | rate:
| |
|
Keith Myers Send message Joined: 13 Dec 17 Posts: 1313 Credit: 6,016,967,459 RAC: 9,922,728 Level Scientific publications | |
|
Your first task link shows 4 attempts at retrieving the necessary python libraries and failing. | |
| ID: 59465 | Rating: 0 | rate:
| |
|
KAMasud Send message Joined: 27 Jul 11 Posts: 137 Credit: 523,901,354 RAC: 0 Level Scientific publications | |
|
Six tasks, all in a row. Errored out. Seven now and another in the works. | |
| ID: 59466 | Rating: 0 | rate:
| |
|
Erich56 Send message Joined: 1 Jan 15 Posts: 1105 Credit: 7,822,620,176 RAC: 1,815,365 Level Scientific publications | |
|
now the same problem on another host :-( | |
| ID: 59467 | Rating: 0 | rate:
| |
|
I joined yesterday and have 13 tasks failed in a row, all with the | |
| ID: 59468 | Rating: 0 | rate:
| |
|
Erich56 Send message Joined: 1 Jan 15 Posts: 1105 Credit: 7,822,620,176 RAC: 1,815,365 Level Scientific publications | |
in view of the above said, the current tasks are probably faulty. No need to reinstall, I guess | |
| ID: 59469 | Rating: 0 | rate:
| |
|
Richard Haselgrove Send message Joined: 11 Jul 09 Posts: 1589 Credit: 6,676,344,351 RAC: 9,081,515 Level Scientific publications | |
|
Yes - just received and returned result 33101290, on a machine which regularly returns good results. | |
| ID: 59470 | Rating: 0 | rate:
| |
|
KAMasud Send message Joined: 27 Jul 11 Posts: 137 Credit: 523,901,354 RAC: 0 Level Scientific publications | |
|
Forty-six failed WU"s? Please stop sending them until the problem is resolved. | |
| ID: 59471 | Rating: 0 | rate:
| |
|
Erich56 Send message Joined: 1 Jan 15 Posts: 1105 Credit: 7,822,620,176 RAC: 1,815,365 Level Scientific publications | |
Forty-six failed WU"s? Please stop sending them until the problem is resolved. + 1 | |
| ID: 59472 | Rating: 0 | rate:
| |
|
KAMasud Send message Joined: 27 Jul 11 Posts: 137 Credit: 523,901,354 RAC: 0 Level Scientific publications | |
Forty-six failed WU"s? Please stop sending them until the problem is resolved. Sorry. After writing the post I looked at the other computer and it had downloaded another. It lasted three minutes or so. It was still in the unzipping process. I cannot understand the txt files so can someone who can check the files to see what is going on? | |
| ID: 59473 | Rating: 0 | rate:
| |
|
+1 | |
| ID: 59474 | Rating: 0 | rate:
| |
|
Erich56 Send message Joined: 1 Jan 15 Posts: 1105 Credit: 7,822,620,176 RAC: 1,815,365 Level Scientific publications | |
I cannot understand the txt files so can someone who can check the files to see what is going on? the task are wrongly configured. Don't download them for the time being. I guess we will get some kind of "go ahead" here once the problem is solved on the project-side. | |
| ID: 59475 | Rating: 0 | rate:
| |
|
abouh Project administrator Project developer Project tester Project scientist Send message Joined: 31 May 21 Posts: 200 Credit: 0 RAC: 0 Level Scientific publications | |
|
Hello, thanks you for reporting the job errors. Sorry to all, there was an error on my side setting up a batch of experiment agents. The errors is due to the specific python script of this batch, not related to the application itself. I have just fixed it, and the new jobs should be running correctly. Unfortunately, some already submitted jobs are bound to fail… I apologise for the inconvenience. They will fail briefly after starting as reported, so not a lot of compute will be wasted. | |
| ID: 59477 | Rating: 0 | rate:
| |
|
Erich56 Send message Joined: 1 Jan 15 Posts: 1105 Credit: 7,822,620,176 RAC: 1,815,365 Level Scientific publications | |
|
abouh, | |
| ID: 59478 | Rating: 0 | rate:
| |
|
abouh Project administrator Project developer Project tester Project scientist Send message Joined: 31 May 21 Posts: 200 Credit: 0 RAC: 0 Level Scientific publications | |
|
Hello! I have checked and the disk space used by the jobs is set to 35e9 bytes. <rsc_disk_bound>35e9</rsc_disk_bound> I will change it first to 20e9, let me know if it helps. I can further decreased it in the future if necessary. ____________ | |
| ID: 59479 | Rating: 0 | rate:
| |
|
Erich56 Send message Joined: 1 Jan 15 Posts: 1105 Credit: 7,822,620,176 RAC: 1,815,365 Level Scientific publications | |
Hello! I have checked and the disk space used by the jobs is set to 35e9 bytes. Thanks, Abouh, for your quick reaction. The change will definitely help - at least in my case with limited disk space due to Ramdisk. | |
| ID: 59480 | Rating: 0 | rate:
| |
Hello, thanks you for reporting the job errors. Sorry to all, there was an error I have just fixed it, and the new jobs should be running correctly. Unfortunately, some already submitted jobs are bound to fail… The problem is not fixed, I still get tasks that fail: AttributeError: 'GWorker' object has no attribute 'batches' | |
| ID: 59481 | Rating: 0 | rate:
| |
|
kotenok2000 Send message Joined: 18 Jul 13 Posts: 78 Credit: 16,175,793 RAC: 9,787 Level Scientific publications | |
|
I have recieved my first new working task. | |
| ID: 59482 | Rating: 0 | rate:
| |
|
KAMasud Send message Joined: 27 Jul 11 Posts: 137 Credit: 523,901,354 RAC: 0 Level Scientific publications | |
|
I wish I could get a sniff also. | |
| ID: 59483 | Rating: 0 | rate:
| |
|
I got another one this morning, still no luck, the task failed as all the other before. Is there something, that I have to change on my side? | |
| ID: 59484 | Rating: 0 | rate:
| |
|
Richard Haselgrove Send message Joined: 11 Jul 09 Posts: 1589 Credit: 6,676,344,351 RAC: 9,081,515 Level Scientific publications | |
|
An example of that: workunit 27329338 has failed for everyone, mine after about 10%. | |
| ID: 59485 | Rating: 0 | rate:
| |
|
abouh Project administrator Project developer Project tester Project scientist Send message Joined: 31 May 21 Posts: 200 Credit: 0 RAC: 0 Level Scientific publications | |
|
I am sorry, old batch jobs are still being mixed with new ones that do run successfully (I have been monitoring them). BOINC will eventually run out of bad jobs, the problems is that it attempts to run them 8 times... | |
| ID: 59486 | Rating: 0 | rate:
| |
|
Richard Haselgrove Send message Joined: 11 Jul 09 Posts: 1589 Credit: 6,676,344,351 RAC: 9,081,515 Level Scientific publications | |
the problems is that it attempts to run them 8 times... Look at that last workunit link. Above the list, it says: max # of error/total/success tasks 7, 10, 6 That's configurable by the project, I think at the application level. You might be able to reduce it a bit? | |
| ID: 59487 | Rating: 0 | rate:
| |
|
abouh Project administrator Project developer Project tester Project scientist Send message Joined: 31 May 21 Posts: 200 Credit: 0 RAC: 0 Level Scientific publications | |
|
Yesterday I was unable to find the specific parameter that defines the number of job attempts. I will ask the main admin. Maybe it is set for all applications. | |
| ID: 59488 | Rating: 0 | rate:
| |
|
Keith Myers Send message Joined: 13 Dec 17 Posts: 1313 Credit: 6,016,967,459 RAC: 9,922,728 Level Scientific publications | |
|
From looking at the server code in create_work.cpp module, the parameter is pulled from the work unit template file. | |
| ID: 59489 | Rating: 0 | rate:
| |
|
Richard Haselgrove Send message Joined: 11 Jul 09 Posts: 1589 Credit: 6,676,344,351 RAC: 9,081,515 Level Scientific publications | |
|
Found some documentation: in https://boinc.berkeley.edu/trac/wiki/JobSubmission The following job parameters may be passed in the input template, or as command-line arguments to create_work; the input template has precedence. If not specified, the given defaults will be used. --target_nresults x I can't find any similar detail for Local web-based job submission or Remote job submission, but it must be buried somewhere in there. You're not using the stated default values, so somebody at GPUGrid must have found it at least once! | |
| ID: 59490 | Rating: 0 | rate:
| |
|
Erich56 Send message Joined: 1 Jan 15 Posts: 1105 Credit: 7,822,620,176 RAC: 1,815,365 Level Scientific publications | |
|
Abouh wrote: Hello, thanks you for reporting the job errors. Sorry to all, there was an error on my side setting up a batch of experiment agents. ... They will fail briefly after starting as reported, so not a lot of compute will be wasted. well, whatever "they will fail briefly after starting" means :-) Mine are failing after 3.780 - 8.597 seconds :-( Is there no way to call them back or delete them from the server? | |
| ID: 59491 | Rating: 0 | rate:
| |
|
abouh Project administrator Project developer Project tester Project scientist Send message Joined: 31 May 21 Posts: 200 Credit: 0 RAC: 0 Level Scientific publications | |
|
I see these values can be set in the app workunit template as mentioned --max_error_results x I have checked, and for PythonGPU and PythonGPU apps the parameters are not specified, so the default values should apply (also coherent with the info previously posted). However, the number of times the server attempts to solve a task by sending it to a GPUGrid machine before giving up is 8. So it does not seem like it is specified by these parameters to me (shouldn't it be 3 according to the default value?). I have asked for help to the admin server, maybe the parameters are overwritten somewhere else. Even if not for this time, it will be convenient to know to solve future issues like this one. Sorry again for the problems. ____________ | |
| ID: 59492 | Rating: 0 | rate:
| |
|
KAMasud Send message Joined: 27 Jul 11 Posts: 137 Credit: 523,901,354 RAC: 0 Level Scientific publications | |
Abouh wrote:Hello, thanks you for reporting the job errors. Sorry to all, there was an error on my side setting up a batch of experiment agents. ... They will fail briefly after starting as reported, so not a lot of compute will be wasted. Not anymore. Anyway, after 9.45 UTC something seems to have changed. I have two Wu's (fingers crossed and touch wood) that have reached 35% in six hours. | |
| ID: 59493 | Rating: 0 | rate:
| |
|
Erich56 Send message Joined: 1 Jan 15 Posts: 1105 Credit: 7,822,620,176 RAC: 1,815,365 Level Scientific publications | |
|
can someone give me advice with regard to the following dilemma: | |
| ID: 59496 | Rating: 0 | rate:
| |
|
Finally, WU #38 worked and was completed within two hours. Thanks, earned my first points here. | |
| ID: 59497 | Rating: 0 | rate:
| |
|
Ian&Steve C. Send message Joined: 21 Feb 20 Posts: 1048 Credit: 40,228,383,983 RAC: 547,485 Level Scientific publications | |
|
reboot the system and free up the VRAM maybe. | |
| ID: 59498 | Rating: 0 | rate:
| |
|
Keith Myers Send message Joined: 13 Dec 17 Posts: 1313 Credit: 6,016,967,459 RAC: 9,922,728 Level Scientific publications | |
|
Browser tabs are notorious RAM eaters. Both in the cpu and gpu if you have hardware acceleration enabled in the browser. | |
| ID: 59499 | Rating: 0 | rate:
| |
|
Ian&Steve C. Send message Joined: 21 Feb 20 Posts: 1048 Credit: 40,228,383,983 RAC: 547,485 Level Scientific publications | |
Browser tabs are notorious RAM eaters. Both in the cpu and gpu if you have hardware acceleration enabled in the browser. good call. forgot the browser can use some GPU resources. that's a good thing to check. ____________ | |
| ID: 59500 | Rating: 0 | rate:
| |
|
Erich56 Send message Joined: 1 Jan 15 Posts: 1105 Credit: 7,822,620,176 RAC: 1,815,365 Level Scientific publications | |
|
many thanks, folks, for your replies regarding my VRAM problem. | |
| ID: 59501 | Rating: 0 | rate:
| |
|
Keith Myers Send message Joined: 13 Dec 17 Posts: 1313 Credit: 6,016,967,459 RAC: 9,922,728 Level Scientific publications | |
|
I think you may have to accept the tasks are what they are. Variable because of the different parameter sets. Some may use little RAM and some may use a lot. | |
| ID: 59502 | Rating: 0 | rate:
| |
|
Erich56 Send message Joined: 1 Jan 15 Posts: 1105 Credit: 7,822,620,176 RAC: 1,815,365 Level Scientific publications | |
I think you may have to accept the tasks are what they are. Variable because of the different parameter sets. Some may use little RAM and some may use a lot. yes, meanwhile I noticed on the other two hosts which are running Pythons ATM: the amount of VRAM used varies. No problem of course on the host with the Quadro P5000 which comes with 16GB. Out of which only some 7.5GB are being used even with 4 tasks in parallel, due to the lower number of CUDA cores of this GPU. | |
| ID: 59503 | Rating: 0 | rate:
| |
|
Ian&Steve C. Send message Joined: 21 Feb 20 Posts: 1048 Credit: 40,228,383,983 RAC: 547,485 Level Scientific publications | |
|
are newer tasks using more VRAM? or is there something on your system using more VRAM? | |
| ID: 59504 | Rating: 0 | rate:
| |
|
Erich56 Send message Joined: 1 Jan 15 Posts: 1105 Credit: 7,822,620,176 RAC: 1,815,365 Level Scientific publications | |
what is the breakdown of VRAM used by the different processes? that will tell you what process is actually using the vram hm, I will have to find a tool that tells me :-) Any recommendation? | |
| ID: 59505 | Rating: 0 | rate:
| |
|
Keith Myers Send message Joined: 13 Dec 17 Posts: 1313 Credit: 6,016,967,459 RAC: 9,922,728 Level Scientific publications | |
what is the breakdown of VRAM used by the different processes? that will tell you what process is actually using the vram nvidia-smi in the Terminal does nicely. | |
| ID: 59506 | Rating: 0 | rate:
| |
|
Ian&Steve C. Send message Joined: 21 Feb 20 Posts: 1048 Credit: 40,228,383,983 RAC: 547,485 Level Scientific publications | |
|
check here for nvidia-smi use on Windows. it's easy on Linux, but less intuitive on Windows | |
| ID: 59507 | Rating: 0 | rate:
| |
|
Erich56 Send message Joined: 1 Jan 15 Posts: 1105 Credit: 7,822,620,176 RAC: 1,815,365 Level Scientific publications | |
|
my hosts still keep receiving faulty tasks which are totally "fresh", no re-submitted ones. | |
| ID: 59510 | Rating: 0 | rate:
| |
|
Erich56 Send message Joined: 1 Jan 15 Posts: 1105 Credit: 7,822,620,176 RAC: 1,815,365 Level Scientific publications | |
my hosts still keep receiving faulty tasks which are totally "fresh", no re-submitted ones. I was out for a few hours, and when I came back, I noticed 2 more failed tasks (both ran for almost 3 hours before they crashed). Whereas at the beginning of the problem, the tasks failed - as also Abouh noted - within short time so that there was not too much of waste, now these tasks fail only after several hours. Within the past 24 hours, my hosts' total computation time of all the failing tasks was 104.526 seconds = 29 hours! I am very much willing to support the science with my time, my equipment and my permanently increasing electricity bill as long as it makes sense (and as long as I can afford it). FYI, my electricity costs have more than tripled since the beginning of the year, for known reasons. That's significant! I simply cannot believe that all these faulty tasks in the big download bucket cannot be stopped, retrieved, cancelled or what ever else. It makes absolutely no sense to leave them in there and send them out to us for the next several weeks. If the GPUGRID people cannot confirm that they are finding a way quickly to stop these faulty tasks, I have no other choice, as sorry as I am, to switch to other projects :-( | |
| ID: 59511 | Rating: 0 | rate:
| |
|
bozz4science Send message Joined: 22 May 20 Posts: 109 Credit: 68,936,176 RAC: 0 Level Scientific publications | |
|
For the time being, I already suspended receiving new tasks and reverted back to E@H & F@H as long as this situation with faulty tasks has been sorted out. | |
| ID: 59512 | Rating: 0 | rate:
| |
|
KAMasud Send message Joined: 27 Jul 11 Posts: 137 Credit: 523,901,354 RAC: 0 Level Scientific publications | |
|
Most peculiar, I have had no failed task. Seven so far. | |
| ID: 59513 | Rating: 0 | rate:
| |
|
abouh Project administrator Project developer Project tester Project scientist Send message Joined: 31 May 21 Posts: 200 Credit: 0 RAC: 0 Level Scientific publications | |
|
I have reviewed your recent tasks and there is a mix of faulty and successful tasks. The successful ones are newer and are the only ones being submitted now. | |
| ID: 59514 | Rating: 0 | rate:
| |
|
Richard Haselgrove Send message Joined: 11 Jul 09 Posts: 1589 Credit: 6,676,344,351 RAC: 9,081,515 Level Scientific publications | |
|
@ Erich56: you have to look into the history and the reason for the crashes. I got one of the last replications from workunit 27327972 last night - but that's one that was created on 16 October, almost a week ago. it's just that the first owner hung on to it for five days and did nothing. That's not the project's fault, even if the initial error was. | |
| ID: 59515 | Rating: 0 | rate:
| |
|
Erich56 Send message Joined: 1 Jan 15 Posts: 1105 Credit: 7,822,620,176 RAC: 1,815,365 Level Scientific publications | |
For the last 2-3 days only good tasks have been sent. thanks, Abouh, for your reply. When you say what I quoted above - you are talking about "fresh" tasks, right? However, repetitions (up to 8) of the former, faulty tasks are still going out. Just an example of a task which one of my hosts received this morning, and which failed after about 2 1/2 hours: https://www.gpugrid.net/result.php?resultid=33112434 | |
| ID: 59516 | Rating: 0 | rate:
| |
|
Richard Haselgrove Send message Joined: 11 Jul 09 Posts: 1589 Credit: 6,676,344,351 RAC: 9,081,515 Level Scientific publications | |
|
Likewise. Since I posted, I've received another one which is likely to go the same way, from workunit 27328975. Another 5-day no-show by a Science United user. | |
| ID: 59517 | Rating: 0 | rate:
| |
|
Maybe, that person misjugded how long these tasks can take. If that person asked for a stock of tasks for 7 or 10 days, some probably will never start on that machine before the deadline. | |
| ID: 59518 | Rating: 0 | rate:
| |
|
KAMasud Send message Joined: 27 Jul 11 Posts: 137 Credit: 523,901,354 RAC: 0 Level Scientific publications | |
Maybe, that person misjugded how long these tasks can take. If that person asked for a stock of tasks for 7 or 10 days, some probably will never start on that machine before the deadline. Mine are set to ten plus ten days but I still get one. This is not the reason. | |
| ID: 59519 | Rating: 0 | rate:
| |
|
Ian&Steve C. Send message Joined: 21 Feb 20 Posts: 1048 Credit: 40,228,383,983 RAC: 547,485 Level Scientific publications | |
For the last 2-3 days only good tasks have been sent. When you get a resend, especially a high number resend like that, check the reason that it was resent so much. If there’s tons of errors, probably safe to just abort it and not waste your time on it. Especially when you know a bunch of bad tasks had gone out recently. ____________ | |
| ID: 59520 | Rating: 0 | rate:
| |
|
Ian&Steve C. Send message Joined: 21 Feb 20 Posts: 1048 Credit: 40,228,383,983 RAC: 547,485 Level Scientific publications | |
Maybe, that person misjugded how long these tasks can take. If that person asked for a stock of tasks for 7 or 10 days, some probably will never start on that machine before the deadline. Ideally, when the task approaches the deadline it should jump into high priority mode and jump to the front of the line for task priority. But the process doesn’t always work ideally with BOINC. But there are also many people who blindly download tasks then shut off their computer for extended periods of time. ____________ | |
| ID: 59521 | Rating: 0 | rate:
| |
|
abouh Project administrator Project developer Project tester Project scientist Send message Joined: 31 May 21 Posts: 200 Credit: 0 RAC: 0 Level Scientific publications | |
|
Yes, I meant fresh tasks, which would be sent out to for the first time out of 8 possible attempts. | |
| ID: 59522 | Rating: 0 | rate:
| |
|
Erich56 Send message Joined: 1 Jan 15 Posts: 1105 Credit: 7,822,620,176 RAC: 1,815,365 Level Scientific publications | |
|
Ian&Steve C. wrote: When you get a resend, especially a high number resend like that, check the reason that it was resent so much. If there’s tons of errors, probably safe to just abort it and not waste your time on it. Especially when you know a bunch of bad tasks had gone out recently. Well, not a bad idea, if I had the time to babysit my hosts 24/7 :-) However, this would end up with a problem rather quickly: isn't it still the case that once a certain number of downloaded tasks is being deleted, no further ones will be sent within the following 24 hours? In fact, I remember that this was even true for failing tasks in the past, based on the assumption that there is something wrong with the host. So, in view of the many failed tasks now, I am surprised that I still get new ones within the mentioned 24 hours ban. | |
| ID: 59523 | Rating: 0 | rate:
| |
|
Keith Myers Send message Joined: 13 Dec 17 Posts: 1313 Credit: 6,016,967,459 RAC: 9,922,728 Level Scientific publications | |
|
Depends on how they have set up the server software. | |
| ID: 59524 | Rating: 0 | rate:
| |
|
Erich56 Send message Joined: 1 Jan 15 Posts: 1105 Credit: 7,822,620,176 RAC: 1,815,365 Level Scientific publications | |
|
Crazy, I had another task which failed after more than 20 hours :-( | |
| ID: 59525 | Rating: 0 | rate:
| |
|
Keith Myers Send message Joined: 13 Dec 17 Posts: 1313 Credit: 6,016,967,459 RAC: 9,922,728 Level Scientific publications | |
|
Must be a Windows thing. None of my "bad" formatted tasks run longer than ~40 minutes or so before failing out. | |
| ID: 59526 | Rating: 0 | rate:
| |
|
KAMasud Send message Joined: 27 Jul 11 Posts: 137 Credit: 523,901,354 RAC: 0 Level Scientific publications | |
Crazy, I had another task which failed after more than 20 hours :-( The tasks that were failing were taking around three minutes not twenty hours. | |
| ID: 59527 | Rating: 0 | rate:
| |
|
Erich56 Send message Joined: 1 Jan 15 Posts: 1105 Credit: 7,822,620,176 RAC: 1,815,365 Level Scientific publications | |
for sure NOT 3 minutes. Example here: 20 Oct 2022 | 1:19:26 UTC 20 Oct 2022 | 2:57:36 UTC Error while computing 3,780.66 3,780.66 --- Python apps for GPU hosts v4.04 (cuda1131) so, in above example, the task failed after 1 Hr 38 mins. 20 Oct 2022 | 1:44:50 UTC 20 Oct 2022 | 3:08:40 UTC Error while computing 5,195.80 5,195.80 --- Python apps for GPU hosts v4.04 (cuda1131) here, the task failed after 1 hr 23 mins. but, interestingly enough, here the relation is quite different: 22 Oct 2022 | 6:41:59 UTC 22 Oct 2022 | 7:07:44 UTC Error while computing 70,694.64 70,694.64 --- Python apps for GPU hosts v4.04 (cuda1131) the task obviously failed after 25 minutes, although runtime and CPU time as indicated would suggest >19 hrs. These indications are somewhat unclear (to me). | |
| ID: 59528 | Rating: 0 | rate:
| |
|
Keith Myers Send message Joined: 13 Dec 17 Posts: 1313 Credit: 6,016,967,459 RAC: 9,922,728 Level Scientific publications | |
|
You MUST absolutely ignore any reported times for cpu_time and run_time for the Python tasks. | |
| ID: 59529 | Rating: 0 | rate:
| |
|
KAMasud Send message Joined: 27 Jul 11 Posts: 137 Credit: 523,901,354 RAC: 0 Level Scientific publications | |
|
I get one task at a time also. | |
| ID: 59530 | Rating: 0 | rate:
| |
|
Richard Haselgrove Send message Joined: 11 Jul 09 Posts: 1589 Credit: 6,676,344,351 RAC: 9,081,515 Level Scientific publications | |
|
@ Erich56, @ KAMasud | |
| ID: 59531 | Rating: 0 | rate:
| |
|
[AF] fansyl Send message Joined: 26 Sep 13 Posts: 20 Credit: 1,714,356,441 RAC: 368 Level Scientific publications | |
|
Hello, | |
| ID: 59532 | Rating: 0 | rate:
| |
|
Richard Haselgrove Send message Joined: 11 Jul 09 Posts: 1589 Credit: 6,676,344,351 RAC: 9,081,515 Level Scientific publications | |
Example: https://www.gpugrid.net/result.php?resultid=33109419 OSError: [WinError 1455] Le fichier de pagination est insuffisant pour terminer cette opération. Error loading "D:\BOINC\slots\3\lib\site-packages\torch\lib\cudnn_cnn_infer64_8.dll" or one of its dependencies. Your page file still isn't large enough. | |
| ID: 59533 | Rating: 0 | rate:
| |
|
Erich56 Send message Joined: 1 Jan 15 Posts: 1105 Credit: 7,822,620,176 RAC: 1,815,365 Level Scientific publications | |
@ Erich56, @ KAMasud high Richard, I do know how to put a hyperlink into my texts. In my previous posting, my main intention was to show the time the task was received and lateron sent back after failure. So I didn't deem it necessary to hyperlink the task itself. But you are right: there may be more details for you guys which could be of interest, no doubt. So in the future, whenever referring to a given task, I'll hyperlink it. | |
| ID: 59534 | Rating: 0 | rate:
| |
|
Erich56 Send message Joined: 1 Jan 15 Posts: 1105 Credit: 7,822,620,176 RAC: 1,815,365 Level Scientific publications | |
|
Keith wrote: The only time that is meaningful is the elapsed time between time task sent and time task result is reported. That is the closest we can get to figuring out the true elapsed time. But if you carry a large cache, then dead time sitting in your cache awaiting the chance to run inflates the true time. what you say in the last paragraph, is also true for my hosts. I agree to what you wrote in the paragraph before. That's why in my posting, I cited the times where the tasks were received and then reported back, after failure. These were the actual runtimes, no "sitting" time included. | |
| ID: 59535 | Rating: 0 | rate:
| |
|
KAMasud Send message Joined: 27 Jul 11 Posts: 137 Credit: 523,901,354 RAC: 0 Level Scientific publications | |
@ Erich56, @ KAMasud Richard, could you please make a different thread and teach us all the tricks? We would be very grateful. Looked it up in Wikipedia and ended with not much. There should be some page on Boinc itself, can you give the link? | |
| ID: 59536 | Rating: 0 | rate:
| |
|
Richard Haselgrove Send message Joined: 11 Jul 09 Posts: 1589 Credit: 6,676,344,351 RAC: 9,081,515 Level Scientific publications | |
There should be some page on Boinc itself, can you give the link? There is. To the top left of the text entry box where you type a message (just below the word 'Author' on the grey divider line), there's a link: Use BBCode tags to format your text That opens in a separate browser window (or tab), so you can refer to it while composing your message. Use the 'quote' button below this message to see how I've made the link work here. | |
| ID: 59537 | Rating: 0 | rate:
| |
|
Ian&Steve C. Send message Joined: 21 Feb 20 Posts: 1048 Credit: 40,228,383,983 RAC: 547,485 Level Scientific publications | |
|
Erich, you still misunderstand. With these Python tasks you can't just rely on the times that you reported the task. since it looks like your system sat on these tasks for some time before reporting it. you also can't rely on the runtime counters since it's been known for a long time that they are incorrect due to the multithreaded nature of them (more cores = more reported runtime), and that amount that they are incorrect will vary system to system. the ONLY accurate way to check is to look at the timestamps in the stderr output.
link to this one: http://www.gpugrid.net/result.php?resultid=33105596 from the stderr: 04:45:25 (5200): wrapper (7.9.26016): starting 04:45:25 (5200): wrapper: running .\7za.exe (x pythongpu_windows_x86_64__cuda1131.txz -y) 04:48:28 (5200): .\7za.exe exited; CPU time 179.609375 04:48:28 (5200): wrapper: running C:\Windows\system32\cmd.exe (/C "del pythongpu_windows_x86_64__cuda1131.txz") 04:48:29 (5200): C:\Windows\system32\cmd.exe exited; CPU time 0.000000 04:48:29 (5200): wrapper: running .\7za.exe (x pythongpu_windows_x86_64__cuda1131.tar -y) 04:49:00 (5200): .\7za.exe exited; CPU time 30.109375 04:49:00 (5200): wrapper: running C:\Windows\system32\cmd.exe (/C "del pythongpu_windows_x86_64__cuda1131.tar") 04:49:02 (5200): C:\Windows\system32\cmd.exe exited; CPU time 0.000000 04:49:02 (5200): wrapper: running python.exe (run.py) Starting!! ... [lots of traceback errors here] [then..] 04:55:55 (5200): python.exe exited; CPU time 3570.937500 04:55:55 (5200): app exit status: 0x1 04:55:55 (5200): called boinc_finish(195) just look at the timestamps. you started processing the task at 4:45 and boinc finished it at 4:55. it only actually ran for 10 mins. you either waited ~1hr before starting this tasks, or waited ~1hr before reporting it. it is very common behavior for the BOINC client to extend your project communication time when it detects a computation error. 20 Oct 2022 | 1:44:50 UTC 20 Oct 2022 | 3:08:40 UTC Error while computing 5,195.80 5,195.80 --- Python apps for GPU hosts v4.04 (cuda1131) this task here: http://www.gpugrid.net/result.php?resultid=33105606 04:56:11 (9280): wrapper (7.9.26016): starting ... 05:06:33 (9280): called boinc_finish(195) same story here, only ran for 10 minutes. but, interestingly enough, here the relation is quite different: this task here: http://www.gpugrid.net/result.php?resultid=33111849 08:42:24 (6280): wrapper (7.9.26016): starting ... 09:05:40 (6280): called boinc_finish(195) this one ran for about 23mins. there was less of a delay in starting or reporting this one. I hope this clarifies what you should be looking at to make accurate determinations about run time. ____________ | |
| ID: 59538 | Rating: 0 | rate:
| |
|
Richard Haselgrove Send message Joined: 11 Jul 09 Posts: 1589 Credit: 6,676,344,351 RAC: 9,081,515 Level Scientific publications | |
|
BOINC itself makes it even easier to check the numbers. In the root of the BOINC data folder, you'll find a plain text file called job_log_www.gpugrid.net.txt It contains one line for each successful task, newest at the bottom. Here's one of my recent shorties - task 33104232 1666088826 ue 1354514.775804 ct 1290.400000 fe 1000000000000000000 nm e00001a00003-ABOU_rnd_ppod_expand_demos25_17-0-1-RND1967_0 et 541.083257 es 0 That's very dense, but we're only interested in two numbers: ct 1290.400000 et 541.083257 That's "CPU time" and "elapsed time", respectively. You'll see that both of those have been converted to 1,290.40 in the online report. | |
| ID: 59539 | Rating: 0 | rate:
| |
|
Erich56 Send message Joined: 1 Jan 15 Posts: 1105 Credit: 7,822,620,176 RAC: 1,815,365 Level Scientific publications | |
|
ok guys, many thanks for clarification :-) I now got it :-) | |
| ID: 59540 | Rating: 0 | rate:
| |
|
KAMasud Send message Joined: 27 Jul 11 Posts: 137 Credit: 523,901,354 RAC: 0 Level Scientific publications | |
There should be some page on Boinc itself, can you give the link? Thank you, Richard. I will give it a try, at my age. Difficult but where do you get the matter to put in the middle? For example the WU? [quote]27329068[quote] I do not think it will work though. Forget that I even asked. [list]27329068[list] Yuck. How do I get that WU number to pop up? | |
| ID: 59541 | Rating: 0 | rate:
| |
|
Richard Haselgrove Send message Joined: 11 Jul 09 Posts: 1589 Credit: 6,676,344,351 RAC: 9,081,515 Level Scientific publications | |
Thank you, Richard. I will give it a try, at my age. Difficult but where do you get the matter to put in the middle? For example the WU? OK, let's go through it step-by-step. This is how my seventy-year-old brain breaks it down. We'll use the most recent one I linked. I've got it open in another tab. The address bar in that tab is showing the full url: https://www.gpugrid.net/result.php?resultid=33104232 First, I type the word task into the message. task Then, I swipe across that word (all four letters) to highlight it, and click the URL button above the message: {url}task{/url} Then, I put an equals sign in the first bracket, and add that address from the other tab: {url=https://www.gpugrid.net/result.php?resultid=33104232}task{/url} Finally, I double-click on the number, copy it, and paste it in the central section: {url=https://www.gpugrid.net/result.php?resultid=33104232}task 33104232{/url} I've been changing the square brackets into braces, so they can be seen. Changing them back, the finished result is: task 33104232 In summary: The first bracket contains the page on the website you want to take people to. Between the brackets, you can put anything you like - a simple description. The final bracket simply tidies things up neatly. | |
| ID: 59542 | Rating: 0 | rate:
| |
|
KAMasud Send message Joined: 27 Jul 11 Posts: 137 Credit: 523,901,354 RAC: 0 Level Scientific publications | |
Thank you, Richard. I will give it a try, at my age. Difficult but where do you get the matter to put in the middle? For example the WU? At least our brains are at par. Maybe the steamships I worked on. task 27329068 Let us give it a try. I re-edited. :) | |
| ID: 59543 | Rating: 0 | rate:
| |
|
KAMasud Send message Joined: 27 Jul 11 Posts: 137 Credit: 523,901,354 RAC: 0 Level Scientific publications | |
Thank you, Richard. I will give it a try, at my age. Difficult but where do you get the matter to put in the middle? For example the WU? Anyway, as you all can read the txt files being generated get confused about completion time. I watch the Task Manager. As soon as the sawtooth goes, I know. It took three minutes. | |
| ID: 59544 | Rating: 0 | rate:
| |
|
Ian&Steve C. Send message Joined: 21 Feb 20 Posts: 1048 Credit: 40,228,383,983 RAC: 547,485 Level Scientific publications | |
|
This has been reported and explained many times in this thread. These tasks report CPU time as elapsed time. That’s why it’s so far off. Since these tasks are multithreaded, CPU time gets greatly inflated. | |
| ID: 59545 | Rating: 0 | rate:
| |
|
Richard Haselgrove Send message Joined: 11 Jul 09 Posts: 1589 Credit: 6,676,344,351 RAC: 9,081,515 Level Scientific publications | |
These tasks report CPU time as elapsed time. Actually, that's not quite right. The report (made in sched_request_www.gpugrid.net.xml) is accurate - it's after it lands in the server that it's filed in the wrong pocket. I've got a couple of tasks finishing in the next hour / 90 minutes - I'll try to catch the report for one of them. | |
| ID: 59546 | Rating: 0 | rate:
| |
|
Ian&Steve C. Send message Joined: 21 Feb 20 Posts: 1048 Credit: 40,228,383,983 RAC: 547,485 Level Scientific publications | |
|
It’s correct. You just misinterpreted my perspective. | |
| ID: 59547 | Rating: 0 | rate:
| |
|
Richard Haselgrove Send message Joined: 11 Jul 09 Posts: 1589 Credit: 6,676,344,351 RAC: 9,081,515 Level Scientific publications | |
|
Anyway, I caught one just to clarify my perspective. <result> That matches what it says in the job log: ct 151352.900000 et 54305.405065 But not what is says on the website: task 33116901 I'm going on about it, because if it was a problem in the client, we could patch the code and fix it. But because it happens on the server, it's not even worth trying. Precision in language matters. | |
| ID: 59548 | Rating: 0 | rate:
| |
I have a question: Currently, I'm running a Python task with 1 core and one GPU. Would the crunching time decrease, if I allocate more cores to this tasks? 2 cores equals 50%, 4 cores equals 25% ? I know how to tweak the app_config.xml, but I want to ask before I waist time with tinkering. | |
| ID: 59549 | Rating: 0 | rate:
| |
|
Ian&Steve C. Send message Joined: 21 Feb 20 Posts: 1048 Credit: 40,228,383,983 RAC: 547,485 Level Scientific publications | |
I assume you're talking about the app_config settings when you say "allocate". as a reminder, these settings do not change how much CPU is used by the app. the app uses whatever it needs no matter what settings you choose (up to physical constraints). the only way you can constrain CPU use is to do something like run a virtual machine with less cores allocated to it than the host has. otherwise the app still has full access to all your cores, and if you monitor cpu use by the various processes you'll observe this. if you're not running any other tasks (other CPU projects) at the same time, then changing the CPU allocation likely wont have any impact to your completion times since it's already using all of your cores. ____________ | |
| ID: 59550 | Rating: 0 | rate:
| |
|
Thanks for the fast reply. I'm running MCM from WCG on my machine in parallel. I will do a short test and suspend all other tasks. The question is: Will Python add more cores to this task if the other cores become available? | |
| ID: 59551 | Rating: 0 | rate:
| |
|
Ian&Steve C. Send message Joined: 21 Feb 20 Posts: 1048 Credit: 40,228,383,983 RAC: 547,485 Level Scientific publications | |
|
don't think of it in that sense. | |
| ID: 59552 | Rating: 0 | rate:
| |
|
Erich56 Send message Joined: 1 Jan 15 Posts: 1105 Credit: 7,822,620,176 RAC: 1,815,365 Level Scientific publications | |
...the only way you can constrain CPU use is to do something like run a virtual machine with less cores allocated to it than the host has. otherwise the app still has full access to all your cores, and if you monitor cpu use by the various processes you'll observe this. however, you guys recently stated that best way is not to run any other projects while processing Python tasks. I can confirm. A week ago, I ran one LHC-ATLAS task, 2-core (virtual machine) together with 2 Pythons (1 each per GPU), and after a while the system crashed. Since then, only Pythons are being processed - no crashes so far. | |
| ID: 59553 | Rating: 0 | rate:
| |
|
Well, | |
| ID: 59554 | Rating: 0 | rate:
| |
|
Found a nice balance between MCM and Python tasks. Now I run 7 MCM and 1 Python tasks and the CPU load is about 99 %. | |
| ID: 59555 | Rating: 0 | rate:
| |
|
Erich56 Send message Joined: 1 Jan 15 Posts: 1105 Credit: 7,822,620,176 RAC: 1,815,365 Level Scientific publications | |
|
there was a task which ran for about 20 hours and yielded a credit of 45.000 | |
| ID: 59556 | Rating: 0 | rate:
| |
|
abouh Project administrator Project developer Project tester Project scientist Send message Joined: 31 May 21 Posts: 200 Credit: 0 RAC: 0 Level Scientific publications | |
|
Currently, credits are not defined by execution time, but by the maximum possible compute effort. In particular for these AI experiments which consist on training AI agents, a maximum number of learning steps for the AI agents is defined as a target. That means that the agent interacts with its simulated environment and then learns from these interactions a certain amount of time. | |
| ID: 59557 | Rating: 0 | rate:
| |
|
KAMasud Send message Joined: 27 Jul 11 Posts: 137 Credit: 523,901,354 RAC: 0 Level Scientific publications | |
don't think of it in that sense. I have a question also. Maybe Richard might understand better. I run CPDN tasks also which are very few and far between. So I gave zero resources to Moo Wrapper and ran it in parallel. No CPDN task then Moo would send me WUs. Now with GPUgrid tasks, this is not the case. These tasks do not register in Boinc as a task for some reason. If I am crunching a GPUgrid task then I SHOULD not get a Moo task. That is the correct procedure but what happened when I shifted from CPDN to here, I was running one GPUgrid(on all cores) task as well as twelve Moo tasks. That is thirteen tasks. I am not worried about if it can be done but why is this happening? | |
| ID: 59558 | Rating: 0 | rate:
| |
|
Richard Haselgrove Send message Joined: 11 Jul 09 Posts: 1589 Credit: 6,676,344,351 RAC: 9,081,515 Level Scientific publications | |
|
Without having full details of how your copy of BOINC is configured, and how the tasks from each project are configured to run (in particular, the resource assignment for each task type) it's impossible to say. | |
| ID: 59559 | Rating: 0 | rate:
| |
|
[AF] fansyl Send message Joined: 26 Sep 13 Posts: 20 Credit: 1,714,356,441 RAC: 368 Level Scientific publications | |
Example: https://www.gpugrid.net/result.php?resultid=33109419 I need to push swap size file up to 32GB but now it's OK. Even if the GPU activity rate is low and the Python task does not respect the number of threads allocated to it... no problem, go ahead science ! | |
| ID: 59560 | Rating: 0 | rate:
| |
|
KAMasud Send message Joined: 27 Jul 11 Posts: 137 Credit: 523,901,354 RAC: 0 Level Scientific publications | |
Without having full details of how your copy of BOINC is configured, and how the tasks from each project are configured to run (in particular, the resource assignment for each task type) it's impossible to say. Boinc version 7.20.2. Stock, out of the box. If there is a thread where I can learn mischief let me know. It is stock Boinc and I have allocated 100% of resources to GPUGrid plus 0% resources to Moo Wrapper. In case of no task from GPUGrid, I can get Moo tasks. I am in a hot, arid part of South Asia so I have to keep an eye on Temperatures. I don't want a puddle of plastic. Having too many cores is not an advantage in my case. | |
| ID: 59563 | Rating: 0 | rate:
| |
|
STARBASEn Send message Joined: 17 Feb 09 Posts: 91 Credit: 1,603,303,394 RAC: 0 Level Scientific publications | |
|
According to my work in progress listings, I received this WU listed in progress: https://www.gpugrid.net/result.php?resultid=33134063 but it is non existent on the computer. Since it doesn't exist, I can't abort it or anything so the project will have to remove it from my queue and reassign it. | |
| ID: 59573 | Rating: 0 | rate:
| |
|
Erich56 Send message Joined: 1 Jan 15 Posts: 1105 Credit: 7,822,620,176 RAC: 1,815,365 Level Scientific publications | |
|
on one of my hosts a Python has now been running for almost 3 times as long as all the "long" ones before. | |
| ID: 59576 | Rating: 0 | rate:
| |
|
Erich56 Send message Joined: 1 Jan 15 Posts: 1105 Credit: 7,822,620,176 RAC: 1,815,365 Level Scientific publications | |
on one of my hosts a Python has now been running for almost 3 times as long as all the "long" ones before. I now looked up the task history - it failed on 7 other hosts. So I'd better cancel it :-) | |
| ID: 59577 | Rating: 0 | rate:
| |
|
kotenok2000 Send message Joined: 18 Jul 13 Posts: 78 Credit: 16,175,793 RAC: 9,787 Level Scientific publications | |
|
Can you check whether wrapper_run.out changes and number of samples collected? | |
| ID: 59578 | Rating: 0 | rate:
| |
|
kotenok2000 Send message Joined: 18 Jul 13 Posts: 78 Credit: 16,175,793 RAC: 9,787 Level Scientific publications | |
|
File name is conf.yaml | |
| ID: 59579 | Rating: 0 | rate:
| |
|
Erich56 Send message Joined: 1 Jan 15 Posts: 1105 Credit: 7,822,620,176 RAC: 1,815,365 Level Scientific publications | |
File name is conf.yaml I had already abortet the task mentioned above when I now read your posting. But I looked up the figures in a task which is in process right now. It says: 32start_env_steps: 25000000 sticky_actions: true target_env_steps: 50000000 so what exactly do the figures mean: in this case, about half of the task has been processed? | |
| ID: 59580 | Rating: 0 | rate:
| |
|
kotenok2000 Send message Joined: 18 Jul 13 Posts: 78 Credit: 16,175,793 RAC: 9,787 Level Scientific publications | |
|
I think it means that previous crunchers have already crunched up to 25000000 steps and your workunit will continue to 50000000. | |
| ID: 59581 | Rating: 0 | rate:
| |
|
abouh Project administrator Project developer Project tester Project scientist Send message Joined: 31 May 21 Posts: 200 Credit: 0 RAC: 0 Level Scientific publications | |
|
Yes this is exactly what it means. Most parameters in the config file define the specifics of the agent training process. | |
| ID: 59582 | Rating: 0 | rate:
| |
|
Erich56 Send message Joined: 1 Jan 15 Posts: 1105 Credit: 7,822,620,176 RAC: 1,815,365 Level Scientific publications | |
|
what I noticed within the past few days is that the runtime of the Pythons has increased. | |
| ID: 59583 | Rating: 0 | rate:
| |
|
kotenok2000 Send message Joined: 18 Jul 13 Posts: 78 Credit: 16,175,793 RAC: 9,787 Level Scientific publications | |
|
Try to reduce number of simultaneously running workunits. | |
| ID: 59584 | Rating: 0 | rate:
| |
|
Keith Myers Send message Joined: 13 Dec 17 Posts: 1313 Credit: 6,016,967,459 RAC: 9,922,728 Level Scientific publications | |
|
I've rarely had a short runner in weeks. Now almost all tasks take more than 24 hours. | |
| ID: 59585 | Rating: 0 | rate:
| |
|
KAMasud Send message Joined: 27 Jul 11 Posts: 137 Credit: 523,901,354 RAC: 0 Level Scientific publications | |
|
What I am noticing is, my two machines running no other project are completing the tasks which others have errored out on. I think Python loves to run free without companions to keep it company. | |
| ID: 59586 | Rating: 0 | rate:
| |
|
Erich56 Send message Joined: 1 Jan 15 Posts: 1105 Credit: 7,822,620,176 RAC: 1,815,365 Level Scientific publications | |
What I am noticing is, my two machines running no other project are completing the tasks which others have errored out on. I think Python loves to run free without companions to keep it company. this is exactly my observation, too. | |
| ID: 59587 | Rating: 0 | rate:
| |
|
The only thing I noticed: | |
| ID: 59589 | Rating: 0 | rate:
| |
|
kotenok2000 Send message Joined: 18 Jul 13 Posts: 78 Credit: 16,175,793 RAC: 9,787 Level Scientific publications | |
|
Some errored tasks crash because someone was trying to run them on GTX 680 with 2 gb vram. | |
| ID: 59590 | Rating: 0 | rate:
| |
|
KAMasud Send message Joined: 27 Jul 11 Posts: 137 Credit: 523,901,354 RAC: 0 Level Scientific publications | |
|
task 33145039 | |
| ID: 59591 | Rating: 0 | rate:
| |
|
abouh Project administrator Project developer Project tester Project scientist Send message Joined: 31 May 21 Posts: 200 Credit: 0 RAC: 0 Level Scientific publications | |
|
Hello! I just checked the failed submissions of this jobs, and in each case it failed for a different reason. | |
| ID: 59592 | Rating: 0 | rate:
| |
|
abouh Project administrator Project developer Project tester Project scientist Send message Joined: 31 May 21 Posts: 200 Credit: 0 RAC: 0 Level Scientific publications | |
|
These tasks alternate between GPU usage and CPU usage, would it make such a big difference to use Tensor Cores for mixed precision? You would be trading speed for precision but only speeding up the GPU phases. (if) Your network may fail to saturate the GPU(s) with work, and is therefore CPU bound. Amp’s effect on GPU performance won’t matter. ____________ | |
| ID: 59593 | Rating: 0 | rate:
| |
|
Ian&Steve C. Send message Joined: 21 Feb 20 Posts: 1048 Credit: 40,228,383,983 RAC: 547,485 Level Scientific publications | |
|
you'd need to find a way to get the task loaded fully to the GPU. the environment training that you're doing on CPU, can you do that same processing on the GPU? probably. | |
| ID: 59594 | Rating: 0 | rate:
| |
|
KAMasud Send message Joined: 27 Jul 11 Posts: 137 Credit: 523,901,354 RAC: 0 Level Scientific publications | |
These tasks alternate between GPU usage and CPU usage, would it make such a big difference to use Tensor Cores for mixed precision? You would be trading speed for precision but only speeding up the GPU phases. ----------------- Thank you. | |
| ID: 59598 | Rating: 0 | rate:
| |
|
KAMasud Send message Joined: 27 Jul 11 Posts: 137 Credit: 523,901,354 RAC: 0 Level Scientific publications | |
These tasks alternate between GPU usage and CPU usage, would it make such a big difference to use Tensor Cores for mixed precision? You would be trading speed for precision but only speeding up the GPU phases. ----------------- Thank you. | |
| ID: 59599 | Rating: 0 | rate:
| |
|
Pop Piasa Send message Joined: 8 Aug 19 Posts: 252 Credit: 458,054,251 RAC: 0 Level Scientific publications | |
|
I'm being curious here... | |
| ID: 59627 | Rating: 0 | rate:
| |
|
abouh Project administrator Project developer Project tester Project scientist Send message Joined: 31 May 21 Posts: 200 Credit: 0 RAC: 0 Level Scientific publications | |
|
These tasks are a bit particular, because they use multiprocessing and also interleave stages of CPU utilisation with stages of GPU utilisation. | |
| ID: 59639 | Rating: 0 | rate:
| |
|
gemini8 Send message Joined: 3 Jul 16 Posts: 31 Credit: 1,573,937,676 RAC: 5,287,655 Level Scientific publications | |
The multiprocessing nature of the tasks is responsible for the wrong CPU time (BOINC takes into account the time of all threads). I don't think so. The CPU-time should be correct, it's just that the overall runtime is faulty. You can easily see that if you compare the runtime to the send and receive times. ____________ Greetings, Jens | |
| ID: 59640 | Rating: 0 | rate:
| |
|
Pop Piasa Send message Joined: 8 Aug 19 Posts: 252 Credit: 458,054,251 RAC: 0 Level Scientific publications | |
|
Feliz navidad, amigos! | |
| ID: 59652 | Rating: 0 | rate:
| |
|
Keith Myers Send message Joined: 13 Dec 17 Posts: 1313 Credit: 6,016,967,459 RAC: 9,922,728 Level Scientific publications | |
|
This has been commented on extensively in this thread if you had read it. | |
| ID: 59653 | Rating: 0 | rate:
| |
|
kotenok2000 Send message Joined: 18 Jul 13 Posts: 78 Credit: 16,175,793 RAC: 9,787 Level Scientific publications | |
|
You can create app_config.xml with <app_config> <app> <name>PythonGPU</name> <fraction_done_exact/> </app> </app_config> It should make it display more accurate time estimation. | |
| ID: 59655 | Rating: 0 | rate:
| |
|
Erich56 Send message Joined: 1 Jan 15 Posts: 1105 Credit: 7,822,620,176 RAC: 1,815,365 Level Scientific publications | |
You can create app_config.xml with for me, this worked well with all the ACEMD tasks. It does NOT work with the Pythons. I am talking about Windows; maybe it works with Linux, no idea. | |
| ID: 59656 | Rating: 0 | rate:
| |
|
Keith Myers Send message Joined: 13 Dec 17 Posts: 1313 Credit: 6,016,967,459 RAC: 9,922,728 Level Scientific publications | |
|
As I mentioned BOINC has no idea how to display these tasks because they do not fit in ANY category that BOINC is coded for. | |
| ID: 59657 | Rating: 0 | rate:
| |
|
Pop Piasa Send message Joined: 8 Aug 19 Posts: 252 Credit: 458,054,251 RAC: 0 Level Scientific publications | |
|
Thanks for the tips guys. Sorry about being captain obvious there, I just rejoined this project and should have caught up on the thread before reporting my observations. | |
| ID: 59658 | Rating: 0 | rate:
| |
|
Erich56 Send message Joined: 1 Jan 15 Posts: 1105 Credit: 7,822,620,176 RAC: 1,815,365 Level Scientific publications | |
|
Right now: ~ 14.200 "unsent" Python tasks in the queue. | |
| ID: 59676 | Rating: 0 | rate:
| |
|
Pop Piasa Send message Joined: 8 Aug 19 Posts: 252 Credit: 458,054,251 RAC: 0 Level Scientific publications | |
|
Looks good but getting some bad WUs. | |
| ID: 59677 | Rating: 0 | rate:
| |
|
abouh Project administrator Project developer Project tester Project scientist Send message Joined: 31 May 21 Posts: 200 Credit: 0 RAC: 0 Level Scientific publications | |
|
Could you provide the name of the task? I will take a look at the errors. | |
| ID: 59678 | Rating: 0 | rate:
| |
|
Erich56 Send message Joined: 1 Jan 15 Posts: 1105 Credit: 7,822,620,176 RAC: 1,815,365 Level Scientific publications | |
Could you provide the name of the task? I will take a look at the errors. In case you don't want to wait until he reads your posting for replying - look here: http://www.gpugrid.net/results.php?hostid=602606 | |
| ID: 59680 | Rating: 0 | rate:
| |
|
kotenok2000 Send message Joined: 18 Jul 13 Posts: 78 Credit: 16,175,793 RAC: 9,787 Level Scientific publications | |
|
It seems some of them need more pagefile than usual | |
| ID: 59681 | Rating: 0 | rate:
| |
|
Pop Piasa Send message Joined: 8 Aug 19 Posts: 252 Credit: 458,054,251 RAC: 0 Level Scientific publications | |
|
I see the tasks that my host and some others crashed were successfully finished eventually. Sorry to have assumed before the fact. | |
| ID: 59682 | Rating: 0 | rate:
| |
|
Ian&Steve C. Send message Joined: 21 Feb 20 Posts: 1048 Credit: 40,228,383,983 RAC: 547,485 Level Scientific publications | |
|
abouh, while not learner.done(): learner.step() I'm still trying to track down why AMD systems use so much more CPU than Intel systems. I even went so far as to rebuild the numpy module against MKL (yours is using the default BLAS, not MKL or OpenBLAS). and injecting it into the environment package. but it made no difference again. probably because it looks like numpy is barely used in the code anyway and not in the main loop. ____________ | |
| ID: 59683 | Rating: 0 | rate:
| |
|
Erich56 Send message Joined: 1 Jan 15 Posts: 1105 Credit: 7,822,620,176 RAC: 1,815,365 Level Scientific publications | |
|
Pop Piasa wrote: I suspect my host had errors because it was running Mapping Cancer Markers concurrent with Python. Once I suspended WCG tasks it has run error free. I had made the same experience when I began crunching Pythons. Best is not to run anything else. | |
| ID: 59684 | Rating: 0 | rate:
| |
|
theBigAl Send message Joined: 4 Oct 22 Posts: 4 Credit: 1,672,038,633 RAC: 330,997 Level Scientific publications | |
|
I've been running WCG (CPU only tasks though) and GPUGrid concurrently past few days and its working out fine so far. | |
| ID: 59685 | Rating: 0 | rate:
| |
|
Pop Piasa Send message Joined: 8 Aug 19 Posts: 252 Credit: 458,054,251 RAC: 0 Level Scientific publications | |
|
My Intel hosts seem to have no problems, only my Ryzen5-5600X. Same memory in all of them. That is indeed odd because theBigAl is using the exact same processor without errors. one difference is that theBigAl is running Windows 11 where I have Win 10 on my host. | |
| ID: 59686 | Rating: 0 | rate:
| |
|
Keith Myers Send message Joined: 13 Dec 17 Posts: 1313 Credit: 6,016,967,459 RAC: 9,922,728 Level Scientific publications | |
|
Because of the unique issue with virtual memory on Windows compared to Linux, I don't know if running more than a single task is doable, let alone running multiple gpus. | |
| ID: 59689 | Rating: 0 | rate:
| |
|
theBigAl Send message Joined: 4 Oct 22 Posts: 4 Credit: 1,672,038,633 RAC: 330,997 Level Scientific publications | |
My Intel hosts seem to have no problems, only my Ryzen5-5600X. Same memory in all of them. That is indeed odd because theBigAl is using the exact same processor without errors. one difference is that theBigAl is running Windows 11 where I have Win 10 on my host. I dont know if it'll help but I have allocated 100Gb of virtual memory swap for the computer which is probably an overkill but doesn't hurt to try if you got the space. I'll up that to 140Gb when I'll eagerly receive my 3060ti tomorrow and testing out if it can run multiple GPU tasks on Win11 (probably not and even if it does it'll run a lot slower since it'll be CPU bound then) | |
| ID: 59690 | Rating: 0 | rate:
| |
|
Erich56 Send message Joined: 1 Jan 15 Posts: 1105 Credit: 7,822,620,176 RAC: 1,815,365 Level Scientific publications | |
|
Keith Myers wrote: Because of the unique issue with virtual memory on Windows compared to Linux, I don't know if running more than a single task is doable, let alone running multiple gpus. On my host with 1 GTX980ti and 1 Intel i7-4930K I run 2 Pythons concurrently. On my host with 2 RTX3070 and 1 i9-10900KF I run 4 Pythons concurrently. On my host with 1 Quadro P5000 and 2 Xeon E5-2667 v4 I run 4 Pythons concurrently. All Windows 10. No problems at all (except that I don't make it below 24hours with any task) | |
| ID: 59691 | Rating: 0 | rate:
| |
|
Ian&Steve C. Send message Joined: 21 Feb 20 Posts: 1048 Credit: 40,228,383,983 RAC: 547,485 Level Scientific publications | |
|
abouh, NUM_THREADS = "8" os.environ["OMP_NUM_THREADS"] = NUM_THREADS os.environ["OPENBLAS_NUM_THREADS"] = NUM_THREADS os.environ["MKL_NUM_THREADS"] = NUM_THREADS os.environ["CNN_NUM_THREADS"] = NUM_THREADS os.environ["VECLIB_MAXIMUM_THREADS"] = NUM_THREADS os.environ["NUMEXPR_NUM_THREADS"] = NUM_THREADS but it's not a proper fix. I added further workarounds to make this a little more persistent for myself, but it will need to be fixed by the project to fix for everyone. proper fix would be investigating what is the soft error in the error log file, with full access to the job (which we don't have - and we cannot implement proper mp without it). you could band-aid fix with the same edits I have for run.py, but It might cause issues if you have less than 8 threads I guess? or maybe it's fine since the script launches so many processes anyway. I'm still testing to see if there's a point where less threads on run.py actually slows the task down. on these fast CPUs I might be able to run as little as 4. ____________ | |
| ID: 59693 | Rating: 0 | rate:
| |
|
Keith Myers Send message Joined: 13 Dec 17 Posts: 1313 Credit: 6,016,967,459 RAC: 9,922,728 Level Scientific publications | |
|
Thanks for keep digging into this high cpu usage bug Ian. I missed the last convos on your other thread at STH I guess. | |
| ID: 59695 | Rating: 0 | rate:
| |
|
abouh Project administrator Project developer Project tester Project scientist Send message Joined: 31 May 21 Posts: 200 Credit: 0 RAC: 0 Level Scientific publications | |
|
Hello Ian, learner.step() Is the line of code the task spends most time on. this function handles first the collection of data (CPU intensive) + takes one learning step (updating the weights of the agent neural networks, GPU intensive) Regarding your findings with respect to wandb, I could remove the wandb dependency. I can simply make a run.py script that does not use wandb. It is nice to have a way to log extra training information, but not at the cost of reducing task efficiency. And I get a part of that information anyway when the task comes back. I understand that simply getting rid of wandb would be the best solution right? Thanks a lot for your help! If that is the best solution, I will work on a run.py without wandb. I can start using it as soon as the current batch (~10,736 now) is processed ____________ | |
| ID: 59697 | Rating: 0 | rate:
| |
|
Ian&Steve C. Send message Joined: 21 Feb 20 Posts: 1048 Credit: 40,228,383,983 RAC: 547,485 Level Scientific publications | |
Hello Ian, removing wandb could be a start, but it's also possible that it's not the sole cause of the problem. are you able to see any soft errors in the logs from reported tasks? do you have any higher core count (32+ cores) systems in your lab or available to test on? ____________ | |
| ID: 59698 | Rating: 0 | rate:
| |
|
abouh Project administrator Project developer Project tester Project scientist Send message Joined: 31 May 21 Posts: 200 Credit: 0 RAC: 0 Level Scientific publications | |
|
ok, in that case I will start by removing wandb in the next batch of tasks. Let’s see if that improves performance. I will make a post to inform about the submission once it is done, will probably still take a few days since the latest batch is still being processed. NUM_THREADS = "8" Unfortunately the error logs I get do not say much… at least I don’t see any soft errors. Is there any information which can be printed from the run.py script that would help? Regarding full access to the job, the python package we use to train the AI agents is public and mostly based in pytorch, in case anyone is interested (https://github.com/PyTorchRL/pytorchrl). ____________ | |
| ID: 59699 | Rating: 0 | rate:
| |
|
Richard Haselgrove Send message Joined: 11 Jul 09 Posts: 1589 Credit: 6,676,344,351 RAC: 9,081,515 Level Scientific publications | |
|
I think I may have encountered the Linux version of the Windows virtual memory problem. | |
| ID: 59701 | Rating: 0 | rate:
| |
|
kotenok2000 Send message Joined: 18 Jul 13 Posts: 78 Credit: 16,175,793 RAC: 9,787 Level Scientific publications | |
|
There are programs that can display what files use most space on disk. For example K4DirStat | |
| ID: 59702 | Rating: 0 | rate:
| |
|
Ian&Steve C. Send message Joined: 21 Feb 20 Posts: 1048 Credit: 40,228,383,983 RAC: 547,485 Level Scientific publications | |
ok, in that case I will start by removing wandb in the next batch of tasks. Let’s see if that improves performance. I will make a post to inform about the submission once it is done, will probably still take a few days since the latest batch is still being processed. i'm sure if you set those same env flags, you'll get the same result I have. less CPU use and threads used for python per task based on the NUM_THREADS you set. I'm testing "4" now and it doesn't seem slower either. will need to run it a while longer to be sure. let me get back to you if you could print some errors from within the run.py script. and yeah, no worries about waiting for the batch to finish up. still over 9000 tasks to go. ____________ | |
| ID: 59703 | Rating: 0 | rate:
| |
|
Ian&Steve C. Send message Joined: 21 Feb 20 Posts: 1048 Credit: 40,228,383,983 RAC: 547,485 Level Scientific publications | |
I think I may have encountered the Linux version of the Windows virtual memory problem. probably need some more context about the system. how much disk drive space does it have? how much of that space have you allowed BOINC to use? how many Python tasks are you running? Do you have any other projects running that cause high disk use? each expanded and running GPUGRID_Python slot looks to take up about 9GB. (the 2.7GB archive gets copied there, expanded to ~6.xGB, and and archive remains in place). so that's 9 GB per task running + ~5GB for the GPUGRID project folder depending on if you've cleaned up old apps/archives or not. if your project folder is carrying lots of the old apps, a project reset might be in order to clean it out. ____________ | |
| ID: 59704 | Rating: 0 | rate:
| |
|
Richard Haselgrove Send message Joined: 11 Jul 09 Posts: 1589 Credit: 6,676,344,351 RAC: 9,081,515 Level Scientific publications | |
how much disk drive space does it have? This is what BOINC sees:  It's running on a single 512 GB M.2 SSD. Much of that 200 GB is used by the errant project, and is dormant until they get their new upload server fettled. One Python task - the other GPU is excluded by cc_config. Some Einstein GPU tasks are just finishing. Apart from that, just NumberFields (lightweight integer maths). Within the next half hour, the Einstein tasks will vacate the machine. I'll try one Python, solo, as an experiment, and report back. | |
| ID: 59706 | Rating: 0 | rate:
| |
|
Ian&Steve C. Send message Joined: 21 Feb 20 Posts: 1048 Credit: 40,228,383,983 RAC: 547,485 Level Scientific publications | |
|
So it looks like you’ve set BOINC to be allowed use to the whole drive or so? Or only 50%? | |
| ID: 59707 | Rating: 0 | rate:
| |
|
Richard Haselgrove Send message Joined: 11 Jul 09 Posts: 1589 Credit: 6,676,344,351 RAC: 9,081,515 Level Scientific publications | |
|
The machine is primarily a BOINC cruncher, so yes - BOINC is allowed to use what it wants. I'm suspicious about those 'other programs', too - especially as my other Linux machine shows a much lower figure. The main difference between then is that I did an in-situ upgrade from Mint 20.3 to 21 not long ago, and the other machine is still at 20.3 - I suspect there may be a lot of rollback files kept 'just in case'. | |
| ID: 59709 | Rating: 0 | rate:
| |
|
kotenok2000 Send message Joined: 18 Jul 13 Posts: 78 Credit: 16,175,793 RAC: 9,787 Level Scientific publications | |
|
What other project? | |
| ID: 59711 | Rating: 0 | rate:
| |
|
Richard Haselgrove Send message Joined: 11 Jul 09 Posts: 1589 Credit: 6,676,344,351 RAC: 9,081,515 Level Scientific publications | |
What other project? Name redacted to save the blushes of the guilty! | |
| ID: 59712 | Rating: 0 | rate:
| |
|
Richard Haselgrove Send message Joined: 11 Jul 09 Posts: 1589 Credit: 6,676,344,351 RAC: 9,081,515 Level Scientific publications | |
|
Looks like this was a false alarm - the probe task finished successfully, and I've started another. Must have been timeshift all along. | |
| ID: 59713 | Rating: 0 | rate:
| |
|
kotenok2000 Send message Joined: 18 Jul 13 Posts: 78 Credit: 16,175,793 RAC: 9,787 Level Scientific publications | |
|
You mean ithena? | |
| ID: 59714 | Rating: 0 | rate:
| |
|
Ian&Steve C. Send message Joined: 21 Feb 20 Posts: 1048 Credit: 40,228,383,983 RAC: 547,485 Level Scientific publications | |
ok, in that case I will start by removing wandb in the next batch of tasks. Let’s see if that improves performance. I will make a post to inform about the submission once it is done, will probably still take a few days since the latest batch is still being processed. 4 seems to be working fine. abouh, if removing wandb doesn't fix the problem, then adding the env variarables listed above with num_threads = 4 will probably be a suitable workaround for everyone. probably not many hosts with less than 4 threads these days. ____________ | |
| ID: 59737 | Rating: 0 | rate:
| |
|
Ryan Munro Send message Joined: 6 Mar 18 Posts: 33 Credit: 556,297,577 RAC: 79,735 Level Scientific publications | |
|
Excuse the dumb question but would that then mean the app would only spin up 4 threads? | |
| ID: 59757 | Rating: 0 | rate:
| |
|
abouh Project administrator Project developer Project tester Project scientist Send message Joined: 31 May 21 Posts: 200 Credit: 0 RAC: 0 Level Scientific publications | |
|
I have been testing the new script without wandb and the proposed environ configuration and works fine. In my machine performance is similar but looking forward to receiving feedback from other users. | |
| ID: 59761 | Rating: 0 | rate:
| |
|
kotenok2000 Send message Joined: 18 Jul 13 Posts: 78 Credit: 16,175,793 RAC: 9,787 Level Scientific publications | |
|
Can http://www.gpugrid.net/apps.php link be put next to Server status link? | |
| ID: 59762 | Rating: 0 | rate:
| |
|
Ian&Steve C. Send message Joined: 21 Feb 20 Posts: 1048 Credit: 40,228,383,983 RAC: 547,485 Level Scientific publications | |
I have been testing the new script without wandb and the proposed environ configuration and works fine. In my machine performance is similar but looking forward to receiving feedback from other users. thanks abouh! looking forward to testing out the new batch. ____________ | |
| ID: 59764 | Rating: 0 | rate:
| |
|
Keith Myers Send message Joined: 13 Dec 17 Posts: 1313 Credit: 6,016,967,459 RAC: 9,922,728 Level Scientific publications | |
Can http://www.gpugrid.net/apps.php link be put next to Server status link? I'd like to see this change in the website design also. Would be much easier for access than having to manually edit the URL or find the one apps link in the main project JoinUs page. | |
| ID: 59775 | Rating: 0 | rate:
| |
|
Pop Piasa Send message Joined: 8 Aug 19 Posts: 252 Credit: 458,054,251 RAC: 0 Level Scientific publications | |
Can http://www.gpugrid.net/apps.php link be put next to Server status link? You might want to repost that on the wish list thread so it's there when the webmaster gets around to updating the site. I fear they may be too busy at this time. I went ahead and put a link in my browser until then. Thanks for posting that page link. | |
| ID: 59780 | Rating: 0 | rate:
| |
|
Ian&Steve C. Send message Joined: 21 Feb 20 Posts: 1048 Credit: 40,228,383,983 RAC: 547,485 Level Scientific publications | |
Right now: ~ 14.200 "unsent" Python tasks in the queue. now down to less than 500. these went much quicker than I anticipated. only about 3 weeks. ____________ | |
| ID: 59782 | Rating: 0 | rate:
| |
|
Keith Myers Send message Joined: 13 Dec 17 Posts: 1313 Credit: 6,016,967,459 RAC: 9,922,728 Level Scientific publications | |
|
So what again is going to be the status of the expected new application? | |
| ID: 59783 | Rating: 0 | rate:
| |
|
Ryan Munro Send message Joined: 6 Mar 18 Posts: 33 Credit: 556,297,577 RAC: 79,735 Level Scientific publications | |
|
Will the new app be fine on 1 CPU core or will it still require many? on my Windows box atm I have to manually allocate 24 cores to the WU so it does not get starved with other projects running at the same time. | |
| ID: 59784 | Rating: 0 | rate:
| |
|
Keith Myers Send message Joined: 13 Dec 17 Posts: 1313 Credit: 6,016,967,459 RAC: 9,922,728 Level Scientific publications | |
|
Pretty sure you are confusing cores with processes. The app will still spin out 32 python processes. Processes are not cores. | |
| ID: 59787 | Rating: 0 | rate:
| |
|
Ian&Steve C. Send message Joined: 21 Feb 20 Posts: 1048 Credit: 40,228,383,983 RAC: 547,485 Level Scientific publications | |
|
There are two separate mechanisms with this app spinning up multiple processes/threads. The fix will only reduce one of them. Since each task is training 32x agents at once, those 32 processes still spin up. The fix I helped uncover only addresses the unnecessary extra CPU usage from the n-cores extra processes spinning up. I’ve been running with those capped at 4. And it seems fine. | |
| ID: 59788 | Rating: 0 | rate:
| |
|
abouh Project administrator Project developer Project tester Project scientist Send message Joined: 31 May 21 Posts: 200 Credit: 0 RAC: 0 Level Scientific publications | |
|
The job_xxx.xml will also remain the same, since the instructions are as simple as: | |
| ID: 59789 | Rating: 0 | rate:
| |
|
abouh Project administrator Project developer Project tester Project scientist Send message Joined: 31 May 21 Posts: 200 Credit: 0 RAC: 0 Level Scientific publications | |
|
Only 75 jobs in the queue! Thank you all for your support :) | |
| ID: 59790 | Rating: 0 | rate:
| |
|
Ryan Munro Send message Joined: 6 Mar 18 Posts: 33 Credit: 556,297,577 RAC: 79,735 Level Scientific publications | |
|
Yea it spins up that many processes but if I leave the app at default it will get choked because Boinc will only allocate 1 thread to it and the other projects running will take up the other 31 threads. | |
| ID: 59791 | Rating: 0 | rate:
| |
|
KAMasud Send message Joined: 27 Jul 11 Posts: 137 Credit: 523,901,354 RAC: 0 Level Scientific publications | |
Yea it spins up that many processes but if I leave the app at default it will get choked because Boinc will only allocate 1 thread to it and the other projects running will take up the other 31 threads. I, second that. | |
| ID: 59793 | Rating: 0 | rate:
| |
|
abouh Project administrator Project developer Project tester Project scientist Send message Joined: 31 May 21 Posts: 200 Credit: 0 RAC: 0 Level Scientific publications | |
|
I just released the new version of the python library and sent the beta tasks. | |
| ID: 59794 | Rating: 0 | rate:
| |
|
abouh Project administrator Project developer Project tester Project scientist Send message Joined: 31 May 21 Posts: 200 Credit: 0 RAC: 0 Level Scientific publications | |
|
Is there any BOINC specifiable WU parameter for that? I could not find it but I would also like to avoid to the hosts having to manually change configuration if possible | |
| ID: 59795 | Rating: 0 | rate:
| |
|
kotenok2000 Send message Joined: 18 Jul 13 Posts: 78 Credit: 16,175,793 RAC: 9,787 Level Scientific publications | |
|
Use this | |
| ID: 59796 | Rating: 0 | rate:
| |
|
Ryan Munro Send message Joined: 6 Mar 18 Posts: 33 Credit: 556,297,577 RAC: 79,735 Level Scientific publications | |
|
Just grabbed one of the beta units and it still says Running (0.999 CPUs and 1 GPU) but it seems to be fluctuating between 50% and 100% load on my 32-thread CPU. | |
| ID: 59797 | Rating: 0 | rate:
| |
|
abouh Project administrator Project developer Project tester Project scientist Send message Joined: 31 May 21 Posts: 200 Credit: 0 RAC: 0 Level Scientific publications | |
|
But this is on the client side. | |
| ID: 59799 | Rating: 0 | rate:
| |
|
Keith Myers Send message Joined: 13 Dec 17 Posts: 1313 Credit: 6,016,967,459 RAC: 9,922,728 Level Scientific publications | |
|
I don't see any parameter in the jobin page that allocates the number of cpus the task will tie up. | |
| ID: 59800 | Rating: 0 | rate:
| |
|
Ian&Steve C. Send message Joined: 21 Feb 20 Posts: 1048 Credit: 40,228,383,983 RAC: 547,485 Level Scientific publications | |
as you said earlier in your comment, the cpu_use only tells BOINC how much is being used. it does not exert any kind of "control" over the application directly. the previous tasks spun up a run.py child process for every core. these would be linked to the parent process. you can see them in htop. I have not been able to get any of these beta tasks myself (i got some very early morning before I got up, but they errored because of my custom edits) to see what might be going on. but there might be a problem with them still, some other users that got them seem to have errored. ____________ | |
| ID: 59801 | Rating: 0 | rate:
| |
|
Keith Myers Send message Joined: 13 Dec 17 Posts: 1313 Credit: 6,016,967,459 RAC: 9,922,728 Level Scientific publications | |
|
I reset the project on all hosts prior to the release of the beta tasks to start with a clean slate. | |
| ID: 59802 | Rating: 0 | rate:
| |
|
Ian&Steve C. Send message Joined: 21 Feb 20 Posts: 1048 Credit: 40,228,383,983 RAC: 547,485 Level Scientific publications | |
|
what you're showing in your screenshot is exactly what I saw before. the "green" processes are representative of the child processes. before, you would have a number of child threads in the same amount as the number of cores. on my 16-core system there would be 16 children, on the 24-core system there was 24 children, on the 64 core system there was 64 children. and so on, for each running task. | |
| ID: 59803 | Rating: 0 | rate:
| |
|
Richard Haselgrove Send message Joined: 11 Jul 09 Posts: 1589 Credit: 6,676,344,351 RAC: 9,081,515 Level Scientific publications | |
I don't see any parameter in the jobin page that allocates the number of cpus the task will tie up. You're right - it doesn't belong there. It will be set in the <app_version>, through the plan class - see https://boinc.berkeley.edu/trac/wiki/AppPlanSpec. And to amplify Ian's point - not only does BOINC not control the application, it merely allows the specified amount of free resource in which to run. | |
| ID: 59804 | Rating: 0 | rate:
| |
|
Keith Myers Send message Joined: 13 Dec 17 Posts: 1313 Credit: 6,016,967,459 RAC: 9,922,728 Level Scientific publications | |
|
Since these apps aren't proper BOINC MT or multi-threaded apps using a MT plan class, you wouldn't be using the <max_threads>N [M]</max_threads> parameter. | |
| ID: 59805 | Rating: 0 | rate:
| |
|
Keith Myers Send message Joined: 13 Dec 17 Posts: 1313 Credit: 6,016,967,459 RAC: 9,922,728 Level Scientific publications | |
|
Bunch of the standard Python 4.03 versioned tasks have been going out and erroring out. I've had five so far today. | |
| ID: 59806 | Rating: 0 | rate:
| |
|
Pop Piasa Send message Joined: 8 Aug 19 Posts: 252 Credit: 458,054,251 RAC: 0 Level Scientific publications | |
|
Maybe this might help Abou with the scripting, I'm too green at Python to know. | |
| ID: 59807 | Rating: 0 | rate:
| |
|
KAMasud Send message Joined: 27 Jul 11 Posts: 137 Credit: 523,901,354 RAC: 0 Level Scientific publications | |
|
I was allocated two tasks of "ATM: Free energy calculations of protein-ligand binding v1.11 (cuda1121)" and both of them were cancelled by the server in transmission. What are these tasks about and why were they cancelled? | |
| ID: 59808 | Rating: 0 | rate:
| |
|
Keith Myers Send message Joined: 13 Dec 17 Posts: 1313 Credit: 6,016,967,459 RAC: 9,922,728 Level Scientific publications | |
|
The researcher cancelled them because they recognized a problem with how the package was put together and the tasks would fail. | |
| ID: 59809 | Rating: 0 | rate:
| |
|
Keith Myers Send message Joined: 13 Dec 17 Posts: 1313 Credit: 6,016,967,459 RAC: 9,922,728 Level Scientific publications | |
|
I successfully ran one of the beta Python tasks after the first cruncher errored out the task. | |
| ID: 59810 | Rating: 0 | rate:
| |
|
abouh Project administrator Project developer Project tester Project scientist Send message Joined: 31 May 21 Posts: 200 Credit: 0 RAC: 0 Level Scientific publications | |
|
The beta tasks were of the same size as the normal ones. So if they run faster hopefully the future PythonGPU tasks will too. | |
| ID: 59811 | Rating: 0 | rate:
| |
|
abouh Project administrator Project developer Project tester Project scientist Send message Joined: 31 May 21 Posts: 200 Credit: 0 RAC: 0 Level Scientific publications | |
|
Thank you very much for pointing it out. Will look at the error this morning! | |
| ID: 59812 | Rating: 0 | rate:
| |
|
Ian&Steve C. Send message Joined: 21 Feb 20 Posts: 1048 Credit: 40,228,383,983 RAC: 547,485 Level Scientific publications | |
|
finally got some more beta tasks and they seem to be running fine. and now limited to only 4 threads on the main run.py process. | |
| ID: 59813 | Rating: 0 | rate:
| |
|
KAMasud Send message Joined: 27 Jul 11 Posts: 137 Credit: 523,901,354 RAC: 0 Level Scientific publications | |
|
I never blamed anyone. Just asked a question for my own knowledge. Anyway, Thank you. Now I wish I could get a task. | |
| ID: 59814 | Rating: 0 | rate:
| |
|
Erich56 Send message Joined: 1 Jan 15 Posts: 1105 Credit: 7,822,620,176 RAC: 1,815,365 Level Scientific publications | |
... this is definitely bad news for GPUs with 8GB VRAM, like the two RTX3070 in my case. Before, I could run 2 tasks each GPU. It became quite tight, but it worked (with some 70-100MB left on the GPU the monitor is connected to). | |
| ID: 59815 | Rating: 0 | rate:
| |
|
abouh Project administrator Project developer Project tester Project scientist Send message Joined: 31 May 21 Posts: 200 Credit: 0 RAC: 0 Level Scientific publications | |
|
Yes, these latest beta tasks use a little bit more GPU memory. The AI agent has a bigger neural network. Hope it is not too big and most machines can still handle it. | |
| ID: 59816 | Rating: 0 | rate:
| |
|
Ian&Steve C. Send message Joined: 21 Feb 20 Posts: 1048 Credit: 40,228,383,983 RAC: 547,485 Level Scientific publications | |
|
i have 4 of the beta tasks running. the number of threads looks good. using 4 threads per task as specified in the run.py script. | |
| ID: 59817 | Rating: 0 | rate:
| |
|
abouh Project administrator Project developer Project tester Project scientist Send message Joined: 31 May 21 Posts: 200 Credit: 0 RAC: 0 Level Scientific publications | |
|
Great! very helpful feedback Ian thanks. | |
| ID: 59819 | Rating: 0 | rate:
| |
|
Ryan Munro Send message Joined: 6 Mar 18 Posts: 33 Credit: 556,297,577 RAC: 79,735 Level Scientific publications | |
|
Got one of the new Betas, it's using about 28% average of my 16core 5950x in Windows 11 so roughly 9 threads? | |
| ID: 59820 | Rating: 0 | rate:
| |
|
abouh Project administrator Project developer Project tester Project scientist Send message Joined: 31 May 21 Posts: 200 Credit: 0 RAC: 0 Level Scientific publications | |
|
The scripts still spawn 32 python threads. But I think before with wandb and maybe without fixing some environ variables even more were spawned. | |
| ID: 59821 | Rating: 0 | rate:
| |
|
Ryan Munro Send message Joined: 6 Mar 18 Posts: 33 Credit: 556,297,577 RAC: 79,735 Level Scientific publications | |
|
Yea it definitely uses less overall CPU time that before, capped the apps at 10 cores now which seems like the sweet spot to allow me to also run other apps. | |
| ID: 59822 | Rating: 0 | rate:
| |
|
KAMasud Send message Joined: 27 Jul 11 Posts: 137 Credit: 523,901,354 RAC: 0 Level Scientific publications | |
|
task 33269102 | |
| ID: 59823 | Rating: 0 | rate:
| |
|
Ian&Steve C. Send message Joined: 21 Feb 20 Posts: 1048 Credit: 40,228,383,983 RAC: 547,485 Level Scientific publications | |
Great! very helpful feedback Ian thanks. seeing up to 5.6GB VRAM use per task. but it doesnt seem consistent. some tasks will go up to ~4.8, others 4.5, etc. there doesnt seem to be a clear pattern to it. the previous tasks were very consistent and always used exactly the same amount of VRAM. ____________ | |
| ID: 59824 | Rating: 0 | rate:
| |
|
Erich56 Send message Joined: 1 Jan 15 Posts: 1105 Credit: 7,822,620,176 RAC: 1,815,365 Level Scientific publications | |
|
yesterday I downloaded and started 2 Pythons on my box with the Intel Xeon E5 2667v4 (2 CPUs) and the Quadro P5000 inside. | |
| ID: 59825 | Rating: 0 | rate:
| |
|
Ian&Steve C. Send message Joined: 21 Feb 20 Posts: 1048 Credit: 40,228,383,983 RAC: 547,485 Level Scientific publications | |
|
Old low(er) VRAM use tasks are still going out. | |
| ID: 59826 | Rating: 0 | rate:
| |
|
Erich56 Send message Joined: 1 Jan 15 Posts: 1105 Credit: 7,822,620,176 RAC: 1,815,365 Level Scientific publications | |
|
thanks for the hint regarding "old" and "new" tasks. | |
| ID: 59827 | Rating: 0 | rate:
| |
|
Erich56 Send message Joined: 1 Jan 15 Posts: 1105 Credit: 7,822,620,176 RAC: 1,815,365 Level Scientific publications | |
According to the Windows task manager, they seem to run well, although I cannot tell for sure at this early point whether they all use the GPU. I will be able to tell better from the progress bar after some more time (while at least one looks suspicious at this time). is there any other way to find out whether a task is using the GPU at all, except for watching the BOINC Manager progress bar for a while and comparing to each other the progress of the individual running tasks? | |
| ID: 59828 | Rating: 0 | rate:
| |
|
Ian&Steve C. Send message Joined: 21 Feb 20 Posts: 1048 Credit: 40,228,383,983 RAC: 547,485 Level Scientific publications | |
|
as a reference, this is what it's looking like running 3 tasks on 4x A4000s. a good amount of variance in VRAM use. not consistent and I'm not sure if it increases over time, or some tasks just require more than others. but definitely more than before and different behavior than before. | |
| ID: 59829 | Rating: 0 | rate:
| |
|
Keith Myers Send message Joined: 13 Dec 17 Posts: 1313 Credit: 6,016,967,459 RAC: 9,922,728 Level Scientific publications | |
Yes, use nvidia-smi which is installed by the Nvidia drivers. It is located here in Windows. C:\Program Files\NVIDIA Corporation\NVSMI Just open a command window and navigate there and execute: nvidia-smi | |
| ID: 59830 | Rating: 0 | rate:
| |
|
Ian&Steve C. Send message Joined: 21 Feb 20 Posts: 1048 Credit: 40,228,383,983 RAC: 547,485 Level Scientific publications | |
he might look here too. your location is reported to be on older installs. C:\Windows\System32\DriverStore\FileRepository\nvdm*\nvidia-smi.exe i think he needs to include the extension. but yes. nvidia-smi.exe ____________ | |
| ID: 59831 | Rating: 0 | rate:
| |
|
Erich56 Send message Joined: 1 Jan 15 Posts: 1105 Credit: 7,822,620,176 RAC: 1,815,365 Level Scientific publications | |
|
thank you very much, folks, for your help with the Nvidia-SMI. | |
| ID: 59832 | Rating: 0 | rate:
| |
|
Erich56 Send message Joined: 1 Jan 15 Posts: 1105 Credit: 7,822,620,176 RAC: 1,815,365 Level Scientific publications | |
|
further on my posting above: | |
| ID: 59833 | Rating: 0 | rate:
| |
|
Keith Myers Send message Joined: 13 Dec 17 Posts: 1313 Credit: 6,016,967,459 RAC: 9,922,728 Level Scientific publications | |
thank you very much, folks, for your help with the Nvidia-SMI. The access denied is obviously a permission issue. I don't know how to view the properties of a file in Windows. Maybe right-click? Does that show you who "owns" the file? Windows probably has the same ownership options or close enough to Linux where a file has permissions at the system level, the group level and the user level. Maybe the Windows version of nvidia-smi.exe belongs to a Nvidia group which the local user is not a member. Maybe investigate adding the user to the Nvidia group to see if that changes whether the file can be executed. | |
| ID: 59834 | Rating: 0 | rate:
| |
|
Erich56 Send message Joined: 1 Jan 15 Posts: 1105 Credit: 7,822,620,176 RAC: 1,815,365 Level Scientific publications | |
|
thank you, Keith, for your reply re the Nvidia-SMI. I will investigate further tomorrow. | |
| ID: 59835 | Rating: 0 | rate:
| |
|
Erich56 Send message Joined: 1 Jan 15 Posts: 1105 Credit: 7,822,620,176 RAC: 1,815,365 Level Scientific publications | |
|
for the time being, I excluded "device 1" from GPUGRID via setting in the cc_config.xml | |
| ID: 59836 | Rating: 0 | rate:
| |
|
Erich56 Send message Joined: 1 Jan 15 Posts: 1105 Credit: 7,822,620,176 RAC: 1,815,365 Level Scientific publications | |
|
this is one of the Pythons which had only CPU utilization, but NOT GPU utilization. So I aborted it after several hours. | |
| ID: 59837 | Rating: 0 | rate:
| |
|
abouh Project administrator Project developer Project tester Project scientist Send message Joined: 31 May 21 Posts: 200 Credit: 0 RAC: 0 Level Scientific publications | |
|
Hello Erich, os.environ["CUDA_VISIBLE_DEVICES"] = os.environ["GPU_DEVICE_NUM"] Then, the PyTorchRL package tries to detect that specified GPU, and otherwise uses CPU. So if no GPU is detected it can happen what you mention, that CPU is used instead and the task progress becomes much slower. What I can do is add an additional logging message in the run.py scripts that will display whether or not the GPU device was detected. So we will know for sure. Furthermore, I have found a way to reduce at least a bit the GPU memory requirements. I will start using in the newly submitted tasks. ____________ | |
| ID: 59838 | Rating: 0 | rate:
| |
|
Ian&Steve C. Send message Joined: 21 Feb 20 Posts: 1048 Credit: 40,228,383,983 RAC: 547,485 Level Scientific publications | |
|
Thanks abouh! | |
| ID: 59839 | Rating: 0 | rate:
| |
|
Erich56 Send message Joined: 1 Jan 15 Posts: 1105 Credit: 7,822,620,176 RAC: 1,815,365 Level Scientific publications | |
|
hello abouh, | |
| ID: 59840 | Rating: 0 | rate:
| |
|
Keith Myers Send message Joined: 13 Dec 17 Posts: 1313 Credit: 6,016,967,459 RAC: 9,922,728 Level Scientific publications | |
|
Abouh, | |
| ID: 59841 | Rating: 0 | rate:
| |
|
Ian&Steve C. Send message Joined: 21 Feb 20 Posts: 1048 Credit: 40,228,383,983 RAC: 547,485 Level Scientific publications | |
|
Keith, you need to remove your "tweaking". it's trying to replace the run.py script workaround thing that we were doing before. the old run.py script is not compatible with the new tasks. | |
| ID: 59842 | Rating: 0 | rate:
| |
|
Keith Myers Send message Joined: 13 Dec 17 Posts: 1313 Credit: 6,016,967,459 RAC: 9,922,728 Level Scientific publications | |
Keith, you need to remove your "tweaking". it's trying to replace the run.py script workaround thing that we were doing before. the old run.py script is not compatible with the new tasks. Nope. Absolutely NOT the case. The run.py is the one provided by the project. Look at the link I provided, every other wingman is failing the task also. Along with all the other failed tasks. I'm damn sure I reset the project. Resetting again. | |
| ID: 59843 | Rating: 0 | rate:
| |
|
Ian&Steve C. Send message Joined: 21 Feb 20 Posts: 1048 Credit: 40,228,383,983 RAC: 547,485 Level Scientific publications | |
|
Your stederr output from your failed task in your link clearly indicated that it copied the run.py file. Or was still trying to. | |
| ID: 59844 | Rating: 0 | rate:
| |
|
Pop Piasa Send message Joined: 8 Aug 19 Posts: 252 Credit: 458,054,251 RAC: 0 Level Scientific publications | |
|
Is there any way to reduce the estimated remaining time showing in the manager on these? Tasks won't finish in time: BOINC runs 100.0% of the time; computation is enabled 99.9% of that It appears that the server sets completion times based on the average among completed WU run times. Seeing that Pythons misreport the run time (which must be equal to or greater than the CPU time) it is logical that the estimated future completion times would reflect the inflated CPU time figures. Is there a local manager config fix for that, anyone? Multi gratis | |
| ID: 59845 | Rating: 0 | rate:
| |
|
abouh Project administrator Project developer Project tester Project scientist Send message Joined: 31 May 21 Posts: 200 Credit: 0 RAC: 0 Level Scientific publications | |
|
Hello Keith, sys.stderr.write(f"Detected GPUs: {gpus_detected}\n") Which is only printed with the new runs but not in the one you shared. For example, in this one: https://www.gpugrid.net/result.php?resultid=33273691 ____________ | |
| ID: 59846 | Rating: 0 | rate:
| |
|
KAMasud Send message Joined: 27 Jul 11 Posts: 137 Credit: 523,901,354 RAC: 0 Level Scientific publications | |
Is there any way to reduce the estimated remaining time showing in the manager on these? ___________________ I will agree with Pop. The same thing is going on, on my machine. | |
| ID: 59847 | Rating: 0 | rate:
| |
|
Ian&Steve C. Send message Joined: 21 Feb 20 Posts: 1048 Credit: 40,228,383,983 RAC: 547,485 Level Scientific publications | |
|
abouh, are you planning to release another large batch of the new tasks? | |
| ID: 59848 | Rating: 0 | rate:
| |
|
abouh Project administrator Project developer Project tester Project scientist Send message Joined: 31 May 21 Posts: 200 Credit: 0 RAC: 0 Level Scientific publications | |
|
Yes! The experiment I am currently running has a population of 1000 (so it maintains the number of submitted tasks to 1000 by sending a task every time 1 ends until a certain global goal is reached) | |
| ID: 59849 | Rating: 0 | rate:
| |
|
abouh Project administrator Project developer Project tester Project scientist Send message Joined: 31 May 21 Posts: 200 Credit: 0 RAC: 0 Level Scientific publications | |
|
Unfortunately I think the best reference is the progress %. I don't know if that is of much help to calculate at what time a task will end, but the progress increase should be constant as long as the machine load is also constant throughout the task. | |
| ID: 59850 | Rating: 0 | rate:
| |
|
Pop Piasa Send message Joined: 8 Aug 19 Posts: 252 Credit: 458,054,251 RAC: 0 Level Scientific publications | |
|
Thanks abouh, | |
| ID: 59851 | Rating: 0 | rate:
| |
|
Richard Haselgrove Send message Joined: 11 Jul 09 Posts: 1589 Credit: 6,676,344,351 RAC: 9,081,515 Level Scientific publications | |
Unfortunately I think the best reference is the progress %. I don't know if that is of much help to calculate at what time a task will end, but the progress increase should be constant as long as the machine load is also constant throughout the task. And that can be easily utilised by setting fraction_done_exact in app_config.xml. It wobbles a bit at the beginning, but soon settles down. | |
| ID: 59852 | Rating: 0 | rate:
| |
|
KAMasud Send message Joined: 27 Jul 11 Posts: 137 Credit: 523,901,354 RAC: 0 Level Scientific publications | |
Unfortunately I think the best reference is the progress %. I don't know if that is of much help to calculate when a task will end, but the progress increase should be constant as long as the machine load is also constant throughout the task. ______________ Richard, could you point me in the direction of app_config.xml. Where is it? Second, are we not playing around a bit too much? No other project requires us to play. Unless we are up to mischief and try to run multiple WU's at the same time and when they start crashing, blame others. | |
| ID: 59853 | Rating: 0 | rate:
| |
|
Richard Haselgrove Send message Joined: 11 Jul 09 Posts: 1589 Credit: 6,676,344,351 RAC: 9,081,515 Level Scientific publications | |
|
It's documented in the User manual, specifically at: | |
| ID: 59854 | Rating: 0 | rate:
| |
|
KAMasud Send message Joined: 27 Jul 11 Posts: 137 Credit: 523,901,354 RAC: 0 Level Scientific publications | |
It's documented in the User manual, specifically at: _____________ That I can find but not on my computer unless it is hidden. | |
| ID: 59855 | Rating: 0 | rate:
| |
|
Erich56 Send message Joined: 1 Jan 15 Posts: 1105 Credit: 7,822,620,176 RAC: 1,815,365 Level Scientific publications | |
_____________ the app_config.xml is not there automatically, that's why you won't find it. You need to write it yourself e.g. by the Editor or Notepad, than save it as "app_config.xml" in the GPUGRID project folder within the BOINC folder (contained in the ProgramData folder). In order to put the app_config.xml into effekt, after having done the above mentioned steps, you need to open the "Options" tab in the BOINC manager and push once "read config files". | |
| ID: 59856 | Rating: 0 | rate:
| |
|
KAMasud Send message Joined: 27 Jul 11 Posts: 137 Credit: 523,901,354 RAC: 0 Level Scientific publications | |
_____________ _______________________________ Is this Boinc in only one place? OS(C) Program files Boinc Locale Skins Boinc boinc_logo_black Boinccmd Boincmgr Boincscr boincsvcctrl boinctray ca-bundle COPYING COPYRIGHT liberationSans-Regular. This is all I can find in the Boinc folder. no GPUGrid folder or any other project folder. Unless, Boinc is in two places like in the old days. | |
| ID: 59857 | Rating: 0 | rate:
| |
|
Pop Piasa Send message Joined: 8 Aug 19 Posts: 252 Credit: 458,054,251 RAC: 0 Level Scientific publications | |
|
Thank you Richard Hazelgrove, It's documented in the User manual, specifically at: I was unaware of that info site. Will cure my ignorance. Many thanks. ____________ "Together we crunch To check out a hunch And wish all our credit Could just buy us lunch" Piasa Tribe - Illini Nation | |
| ID: 59858 | Rating: 0 | rate:
| |
|
Erich56 Send message Joined: 1 Jan 15 Posts: 1105 Credit: 7,822,620,176 RAC: 1,815,365 Level Scientific publications | |
You are in the wrong folder. BOINC still is in two places. Your have to navigate to C:/ProgramData/BOINC/projects/GPUGRID | |
| ID: 59859 | Rating: 0 | rate:
| |
|
Pop Piasa Send message Joined: 8 Aug 19 Posts: 252 Credit: 458,054,251 RAC: 0 Level Scientific publications | |
|
Hi KAMasud, Your have to navigate to C:/ProgramData/BOINC/projects/GPUGRID ...is a hidden folder in windows so you must choose to show hidden folders in the file preferences to access it. (just in case you might not know that and can't see it in the program manager) [Edit] The target folder for the appconfig.xml file is actually C:\ProgramData\BOINC\projects\www.gpugrid.net on my hosts Hope that helped. | |
| ID: 59860 | Rating: 0 | rate:
| |
|
Erich56 Send message Joined: 1 Jan 15 Posts: 1105 Credit: 7,822,620,176 RAC: 1,815,365 Level Scientific publications | |
[Edit] The target folder for the appconfig.xml file is actually yes, this is true. Sorry for the confusion. However, on my system (Windows 10 Pro) this folder is NOT a hidden folder. | |
| ID: 59862 | Rating: 0 | rate:
| |
|
KAMasud Send message Joined: 27 Jul 11 Posts: 137 Credit: 523,901,354 RAC: 0 Level Scientific publications | |
Hi KAMasud, ____________________ Thank you, Pop. After this update from Microsoft, Windows has become ____. Needs Administrator privileges for everything. Even though it is my private computer. Yesterday, I marked show hidden folders it promptly hid them back. Today I unhid them and told it "stay", good doggy. I found the second folder in which I found the projects folders. Thank you everyone. Fat32 was better in some ways. I have done what you all wanted me to do but years ago. Maybe two decades ago. Erich, Richard, thank you. Apple products are user repair unfriendly. Laptops are becoming repair unfriendly and now, Microsoft, is going the same way. | |
| ID: 59863 | Rating: 0 | rate:
| |
|
Retvari Zoltan Send message Joined: 20 Jan 09 Posts: 2343 Credit: 16,201,255,749 RAC: 0 Level Scientific publications | |
|
I've been away from GPUGrid for a while... <setenv>NTHREADS=$NTHREADS</setenv> in linux_job.###########.xml file to <setenv>NTHREADS=8</setenv> but it made no difference.The task was started with the original NTHREADS setting. Is it the reason for no change in the number of spawned threads, or I should modify something else? | |
| ID: 59900 | Rating: 0 | rate:
| |
|
Ian&Steve C. Send message Joined: 21 Feb 20 Posts: 1048 Credit: 40,228,383,983 RAC: 547,485 Level Scientific publications | |
I've been away from GPUGrid for a while... there is no reason to do this anymore. they already fixed the overused CPU issue. it's now capped at 4x CPU threads and hard coded in the run.py script. but that is in addition to the 32 threads for the agents. there is no way to reduce that unless abouh wanted to use less agents, but i don't think he does at this time. if you want to run python tasks, you need to account for this and just tell BOINC to reserve some extra CPU resources by setting a larger value for the cpu_usage in app_config. i use values between 8-10. but you can experiment with what you are happy with. on my python dedicated system, I stop all other CPU projects as that gives the best performance. ____________ | |
| ID: 59901 | Rating: 0 | rate:
| |
|
Pop Piasa Send message Joined: 8 Aug 19 Posts: 252 Credit: 458,054,251 RAC: 0 Level Scientific publications | |
|
Good to see Zoltan here again, welcome back!😀 | |
| ID: 59902 | Rating: 0 | rate:
| |
|
Pop Piasa Send message Joined: 8 Aug 19 Posts: 252 Credit: 458,054,251 RAC: 0 Level Scientific publications | |
they already fixed the overused CPU issue. it's now capped at 4x CPU threads and hard coded in the run.py script. but that is in addition to the 32 threads for the agents. there is no way to reduce that unless abouh wanted to use less agents, but i don't think he does at this time. I am enjoying watching abouh gain prowess at scripting with each run, using less and less resources as they evolve. Real progress. Godspeed to abouh and crew. | |
| ID: 59903 | Rating: 0 | rate:
| |
|
Retvari Zoltan Send message Joined: 20 Jan 09 Posts: 2343 Credit: 16,201,255,749 RAC: 0 Level Scientific publications | |
My reason to reduce their numbers is to run two tasks at the same time to increase GPU usage, because I need the full heat output of my GPUs to heat our apartment. As I saw it in "Task Manager" the CPU usage of the spawned tasks drops when I start the second task (my CPU doesn't have that many threads).Is there a way to control the number of spawned threads?there is no reason to do this anymore. Could the GPU usage be increased somehow? it's now capped at 4x CPU threads and hard coded in the run.py script. but that is in addition to the 32 threads for the agents.I confirm that. I looked into that script, though I'm not very familiar with python. I've even tried to modify the num_env_processes in conf.yaml, but this file gets overwritten every time I restart the task, even though I removed the rights of the boinc user and the boinc group to write that file. :) if you want to run python tasks, you need to account for this and just tell BOINC to reserve some extra CPU resources by setting a larger value for the cpu_usage in app_config. i use values between 8-10. but you can experiment with what you are happy with. on my python dedicated system, I stop all other CPU projects as that gives the best performance.That's clear I did that. | |
| ID: 59904 | Rating: 0 | rate:
| |
|
KAMasud Send message Joined: 27 Jul 11 Posts: 137 Credit: 523,901,354 RAC: 0 Level Scientific publications | |
|
Good to see you Zoltan. | |
| ID: 59905 | Rating: 0 | rate:
| |
|
KAMasud Send message Joined: 27 Jul 11 Posts: 137 Credit: 523,901,354 RAC: 0 Level Scientific publications | |
Good to see Zoltan here again, welcome back!😀 Pop, there used to be two Program folders as I remember. Program and Program 32. Now there is a hidden Program System folder. Three in all. | |
| ID: 59906 | Rating: 0 | rate:
| |
|
KAMasud Send message Joined: 27 Jul 11 Posts: 137 Credit: 523,901,354 RAC: 0 Level Scientific publications | |
Good to see Zoltan here again, welcome back!😀 Pop, there used to be two Program folders as I remember. Program and Program 32. Now there is a hidden Program System folder. Three in all. | |
| ID: 59907 | Rating: 0 | rate:
| |
|
Ian&Steve C. Send message Joined: 21 Feb 20 Posts: 1048 Credit: 40,228,383,983 RAC: 547,485 Level Scientific publications | |
My reason to reduce their numbers is to run two tasks at the same time to increase GPU usage, because I need the full heat output of my GPUs to heat our apartment. As I saw it in "Task Manager" the CPU usage of the spawned tasks drops when I start the second task (my CPU doesn't have that many threads).Is there a way to control the number of spawned threads?there is no reason to do this anymore. If you need the heat output of the GPU, then you need to run a different project. Or only run ACEMD3 tasks when they are available. You will not get it from the Python tasks in their current state. You can increase the GPU use by adding more tasks concurrently. But not to the extent that you expect or need. I run 4x tasks on my A4000s but they still don’t even have full utilization. Usually only like 40% and ~100W avg power draw. Two tasks aren’t gonna cut it for increasing utilization by any substantial amount. ____________ | |
| ID: 59908 | Rating: 0 | rate:
| |
|
Erich56 Send message Joined: 1 Jan 15 Posts: 1105 Credit: 7,822,620,176 RAC: 1,815,365 Level Scientific publications | |
Good to see you Zoltan. +1 | |
| ID: 59909 | Rating: 0 | rate:
| |
|
Pop Piasa Send message Joined: 8 Aug 19 Posts: 252 Credit: 458,054,251 RAC: 0 Level Scientific publications | |
...I need the full heat output of my GPUs to heat our apartment... It's been a bit chilly in my basement "computer lab/mancave" running these this winter, but I'm saving power($) so I'm bearing it. I just hope they last into summer so I can stay cool here in the humid Mississippi river valley of Illinois. I've had some success running Einstein GPU tasks concurrently with Pythons and saw full GPU usage, although there is of course a longer completion time for both tasks. | |
| ID: 59910 | Rating: 0 | rate:
| |
|
Retvari Zoltan Send message Joined: 20 Jan 09 Posts: 2343 Credit: 16,201,255,749 RAC: 0 Level Scientific publications | |
If you need the heat output of the GPU, then you need to run a different project.I came to that conclusion, again. Or only run ACEMD3 tasks when they are available.I caught 2 or 3, that's why I put 3 host back to GPUGrid. You will not get it [the full GPU heat output] from the Python tasks in their current state.That's regrettable, but it could be ok for me this spring. My main issue with the python app is that I think there's no point running that many spawned (training) threads, as their total (combined) memory access operations cause massive amount of CPU L3 cache misses, hindering each other's performace. Before I've put my i9-12900F host back to GPUGrid, I run 7 TN-Grid tasks + 1 FAH GPU task simultaneously on that host, the average processing time was 4080-4200 sec for the TN-Grid tasks. Now I run 1 GPUGrid task + 1 TN-Grid task simultaneously, and the processing time of the TN-Grid task went up to 4660-4770 sec. Compared to the 6 other TN-Grid tasks plus a FAH task the GPUGrid python task cause a 14% performance loss. You can see the change in processing times for yourself here. If I run only 1 TN-Grid task (no GPU tasks) on that host, the processing time is 3800 seconds. Compared to that, running a GPUGrid pythnon task cause a 22% performance loss. Perhaps this app should do a short benchmark of the given CPU it's actually running on to establish the ideal number of training threads, or give some control of that number for the advanced users like me :) to do that benchmarking of their respective systems. | |
| ID: 59912 | Rating: 0 | rate:
| |
|
Ian&Steve C. Send message Joined: 21 Feb 20 Posts: 1048 Credit: 40,228,383,983 RAC: 547,485 Level Scientific publications | |
|
I don't think you understand what the intention of the researcher is here. he wants 32 agents and the whole experiment is designed around 32 agents. and agent training happens on the CPU, so each agent needs its own process. you can't just arbitrarily reduce this number without the researcher making the change for everyone. it would fundamentally change the research. you could only reduce the number of agents with a new/different experiment. | |
| ID: 59913 | Rating: 0 | rate:
| |
|
abouh Project administrator Project developer Project tester Project scientist Send message Joined: 31 May 21 Posts: 200 Credit: 0 RAC: 0 Level Scientific publications | |
|
Hello everyone, | |
| ID: 59914 | Rating: 0 | rate:
| |
|
Ryan Munro Send message Joined: 6 Mar 18 Posts: 33 Credit: 556,297,577 RAC: 79,735 Level Scientific publications | |
|
I think I am going a bit mad, I set the app_config file to use 0.33 GPU to try and get more units running at the same time, I then remembered 2 is the max, however this config when running 2 seemed to go faster, units completed 25% in about 3 hours, normally I think the units take a lot longer than this. | |
| ID: 59915 | Rating: 0 | rate:
| |
|
Pop Piasa Send message Joined: 8 Aug 19 Posts: 252 Credit: 458,054,251 RAC: 0 Level Scientific publications | |
|
Ryan, here's what works for me: | |
| ID: 59916 | Rating: 0 | rate:
| |
|
Ryan Munro Send message Joined: 6 Mar 18 Posts: 33 Credit: 556,297,577 RAC: 79,735 Level Scientific publications | |
|
Thanks, is 1 CPU per python unit enough? what times are you getting per unit? when I run 8 threads per unit and other tasks on the spare threads my CPU is always running at 100%. | |
| ID: 59917 | Rating: 0 | rate:
| |
|
KAMasud Send message Joined: 27 Jul 11 Posts: 137 Credit: 523,901,354 RAC: 0 Level Scientific publications | |
|
It is not about how many threads your machine has, it is about how many tasks you can run alongside a Python. I have a six-core, twelve threads but can only run three Einstein WUs and my CPU peaks at 82%. A fine balancing act is required and sometimes a GPUGrid WU arrives and I have to suspend other work. | |
| ID: 59918 | Rating: 0 | rate:
| |
|
Keith Myers Send message Joined: 13 Dec 17 Posts: 1313 Credit: 6,016,967,459 RAC: 9,922,728 Level Scientific publications | |
|
Anybody else getting sent Python tasks for the old 1121 app? I have been using the newer 1131 app and it has worked fine on all tasks. | |
| ID: 59920 | Rating: 0 | rate:
| |
|
Erich56 Send message Joined: 1 Jan 15 Posts: 1105 Credit: 7,822,620,176 RAC: 1,815,365 Level Scientific publications | |
Anybody else getting sent Python tasks for the old 1121 app? not so far | |
| ID: 59921 | Rating: 0 | rate:
| |
|
Keith Myers Send message Joined: 13 Dec 17 Posts: 1313 Credit: 6,016,967,459 RAC: 9,922,728 Level Scientific publications | |
|
Based on the number of _x issues of these tasks and everyone else erroring out, must be a scheduler issue. | |
| ID: 59922 | Rating: 0 | rate:
| |
|
Ian&Steve C. Send message Joined: 21 Feb 20 Posts: 1048 Credit: 40,228,383,983 RAC: 547,485 Level Scientific publications | |
|
I've received some of them so far. they fail within like 10 seconds. | |
| ID: 59923 | Rating: 0 | rate:
| |
|
Pop Piasa Send message Joined: 8 Aug 19 Posts: 252 Credit: 458,054,251 RAC: 0 Level Scientific publications | |
is 1 CPU per python unit enough? Ryan, you have a professional market CPU so I can't tell you from experience. Also, I haven't experimented with the CPU figures much yet. I run 1 Python at a time because my hosts are limited in comparison to yours. Seeing your host it looks to me like you can run 2 Pythons simultaneously. (Perhaps Erich56 might share how he manages his very capable i-9 windows host.) what times are you getting per unit? When left to run with no competition for CPU time, my hosts finish a Python task in somewhere between 9 and 12 hrs., depending on the host's CPU. I've found that running either a CPU task or a second GPU task along side of a Python slows it down noticeably, adding an hour or two to the observed run time. This is quite acceptable in my opinion if running one of the ACEMD tasks concurrently, whenever they're available. | |
| ID: 59924 | Rating: 0 | rate:
| |
|
Retvari Zoltan Send message Joined: 20 Jan 09 Posts: 2343 Credit: 16,201,255,749 RAC: 0 Level Scientific publications | |
Anybody else getting sent Python tasks for the old 1121 app?I had four. All have failed on my host, but one of them finished on the 7th resend. Edit: because that was the 1131 app. | |
| ID: 59925 | Rating: 0 | rate:
| |
|
Ian&Steve C. Send message Joined: 21 Feb 20 Posts: 1048 Credit: 40,228,383,983 RAC: 547,485 Level Scientific publications | |
Anybody else getting sent Python tasks for the old 1121 app?I had four. All have failed on my host, but one of them finished on the 7th resend. notice that the host that finished it was with the working v4.03 app. not the troublesome v4.01. the problem is the app that gets assigned to the task, not the task itself. the v4.01 linux app needs to be pulled from the apps list so the scheduler stops trying to use it. ____________ | |
| ID: 59926 | Rating: 0 | rate:
| |
|
Ian&Steve C. Send message Joined: 21 Feb 20 Posts: 1048 Credit: 40,228,383,983 RAC: 547,485 Level Scientific publications | |
|
i've aborted probably about 100 of these tasks getting assigned the bad 4.01 app. | |
| ID: 59927 | Rating: 0 | rate:
| |
|
kotenok2000 Send message Joined: 18 Jul 13 Posts: 78 Credit: 16,175,793 RAC: 9,787 Level Scientific publications | |
|
Does anyone have problems running gpugrid with latest windows update? | |
| ID: 59928 | Rating: 0 | rate:
| |
|
Pop Piasa Send message Joined: 8 Aug 19 Posts: 252 Credit: 458,054,251 RAC: 0 Level Scientific publications | |
i've aborted probably about 100 of these tasks getting assigned the bad 4.01 app. Ian , I've noticed that you had sent back a couple of the tasks I finished. I Thought you were doing as I do and aborting those that won't finish in 24hrs before they start. I am guessing that the error in the script doesn't corrupt the app in windows somehow. I wish I knew why. | |
| ID: 59929 | Rating: 0 | rate:
| |
|
Ian&Steve C. Send message Joined: 21 Feb 20 Posts: 1048 Credit: 40,228,383,983 RAC: 547,485 Level Scientific publications | |
i've aborted probably about 100 of these tasks getting assigned the bad 4.01 app. the error is not with the script or task configuration at all. the problem is the application version that the project is sending. Windows only has one app version, v4.04. Windows hosts will not see a problem with this. Linux used to have only one also, v4.03 which works fine. but something happened a few days ago where the project put up the old v4.01 app for linux from 2021. the scheduler will try to send this app randomly to compatible hosts (any app currently able to run cuda 1131 can also run 1121, so it will send one or the other by chance). this is the problem. it's randomly sending some tasks assigned with the v4.01 app which is not compatible with these newer tasks. https://gpugrid.net/apps.php ____________ | |
| ID: 59930 | Rating: 0 | rate:
| |
|
abouh Project administrator Project developer Project tester Project scientist Send message Joined: 31 May 21 Posts: 200 Credit: 0 RAC: 0 Level Scientific publications | |
|
I it so weird that suddenly jobs are sent to the wrong app version. But you are right, I checked some jobs and for some reason they were sent to the wrong version... The error is the following right? application ./gpugridpy/bin/python missing I did not change the run.py scripts code in the last 2-3 weeks and definitely did not change the scheduler. I also asked the project admins and said the scheduler had not been changed. I know there has been some development recently and a new app has been deployed (ATM) but I would not expect this to affect the PythonGPU app. I will do some digging today, hopefully I can find what happened. ____________ | |
| ID: 59931 | Rating: 0 | rate:
| |
|
Richard Haselgrove Send message Joined: 11 Jul 09 Posts: 1589 Credit: 6,676,344,351 RAC: 9,081,515 Level Scientific publications | |
|
I've been away for a few days, concentrating on another project, and came back to this. I still have the v4.03 files (although I'd reset away the v4.01 files). | |
| ID: 59932 | Rating: 0 | rate:
| |
|
Aurum Send message Joined: 12 Jul 17 Posts: 400 Credit: 13,821,664,882 RAC: 29,957,975 Level Scientific publications | |
I it [sic] so weird that suddenly jobs are sent to [sic] the wrong app versionI haven't run python WUs in a while but when I started them today I first got a pair of 4.01s that both failed and had this message: ==> WARNING: A newer version of conda exists. <== current version: 4.8.3 latest version: 23.1.0 Please update conda by running $ conda update -n base -c defaults conda The next WUs that replaced them were 4.03s and are running fine. Not sure how to check if I now have 23.1.0 installed. | |
| ID: 59933 | Rating: 0 | rate:
| |
|
Ian&Steve C. Send message Joined: 21 Feb 20 Posts: 1048 Credit: 40,228,383,983 RAC: 547,485 Level Scientific publications | |
I it so weird that suddenly jobs are sent to the wrong app version. But you are right, I checked some jobs and for some reason they were sent to the wrong version... The error is the following right? It’s nothing wrong with your scripts. You need to remove the app version 4.01 from the server apps list. So it’s not an option to choose. ____________ | |
| ID: 59934 | Rating: 0 | rate:
| |
|
Richard Haselgrove Send message Joined: 11 Jul 09 Posts: 1589 Credit: 6,676,344,351 RAC: 9,081,515 Level Scientific publications | |
|
My second machine is coming free soon, so I've downloaded a task for that one, too. | |
| ID: 59935 | Rating: 0 | rate:
| |
|
Richard Haselgrove Send message Joined: 11 Jul 09 Posts: 1589 Credit: 6,676,344,351 RAC: 9,081,515 Level Scientific publications | |
task 33308822 has finished and has been deemed to be valid. So if it happens again, and you still have the v4.03 files, changing the version numbers is a valid option. | |
| ID: 59940 | Rating: 0 | rate:
| |
|
Richard Haselgrove Send message Joined: 11 Jul 09 Posts: 1589 Credit: 6,676,344,351 RAC: 9,081,515 Level Scientific publications | |
|
Good thing I checked. Just got allocated two brand new tasks, created today, and they both came allocated to v4.01 | |
| ID: 59942 | Rating: 0 | rate:
| |
|
Ian&Steve C. Send message Joined: 21 Feb 20 Posts: 1048 Credit: 40,228,383,983 RAC: 547,485 Level Scientific publications | |
|
probably would be more effective to just rename/replace the job setup files (jobs.xml, and zipped package). then set <dont_check_file_sizes>. this way it will call what it thinks is the 4.01 files, but it's really calling the 4.03 files. and you wont need to be constantly stopping BOINC to edit the client state each time. | |
| ID: 59943 | Rating: 0 | rate:
| |
|
Richard Haselgrove Send message Joined: 11 Jul 09 Posts: 1589 Credit: 6,676,344,351 RAC: 9,081,515 Level Scientific publications | |
|
It would be easier to simply delete the v4.01 <app_version> and clone the v4.03 section. Then it's just a couple of one-character changes to the version number and the plan class. | |
| ID: 59944 | Rating: 0 | rate:
| |
|
Richard Haselgrove Send message Joined: 11 Jul 09 Posts: 1589 Credit: 6,676,344,351 RAC: 9,081,515 Level Scientific publications | |
|
Well, no new Python tasks this morning, but I've got a couple of resends. | |
| ID: 59945 | Rating: 0 | rate:
| |
|
Ian&Steve C. Send message Joined: 21 Feb 20 Posts: 1048 Credit: 40,228,383,983 RAC: 547,485 Level Scientific publications | |
The second, on host 132158, came through as v4.01, so I tried the "cloned <app_version>" trick. That's running fine, too. But the scheduler sent a whole new <app_version> segment with the task, so I fear the cloning will be undone by the next task issued that's exactly why I suggested to replace the archive and job.xml files with the ones from the 4.03 app (along with the dont_check_file_sizes flag), so you don't have to keep editing the client state file. with replacing the package files instead, it thinks it already has the 4.01 files and uses them unaware that they are really the 4.03 files. but yes, what really needs to happen is the removal of 4.01 from the project side. ____________ | |
| ID: 59946 | Rating: 0 | rate:
| |
|
abouh Project administrator Project developer Project tester Project scientist Send message Joined: 31 May 21 Posts: 200 Credit: 0 RAC: 0 Level Scientific publications | |
|
I have asked the project admins to deprecate version 4.01 and 4.02. Sorry for the delay, I could not do it myself. | |
| ID: 59947 | Rating: 0 | rate:
| |
|
Ian&Steve C. Send message Joined: 21 Feb 20 Posts: 1048 Credit: 40,228,383,983 RAC: 547,485 Level Scientific publications | |
|
Thanks abouh! I see that the v4.01 app is now gone from the applications page, so that should solve the issue for everyone :) | |
| ID: 59949 | Rating: 0 | rate:
| |
|
abouh Project administrator Project developer Project tester Project scientist Send message Joined: 31 May 21 Posts: 200 Credit: 0 RAC: 0 Level Scientific publications | |
|
Yes over the weekend I will review the results of the 2 experiments that just finished and start new ones. The idea is to continue like until now. With two populations of 1000 agents (task) each. | |
| ID: 59950 | Rating: 0 | rate:
| |
|
Richard Haselgrove Send message Joined: 11 Jul 09 Posts: 1589 Credit: 6,676,344,351 RAC: 9,081,515 Level Scientific publications | |
|
And thanks from me, too. That went very smoothly, and allocation of v4.03 hasn't been disturbed. Another resend has arrived for processing when this one finishes, without manual intervention. | |
| ID: 59951 | Rating: 0 | rate:
| |
|
Aurum Send message Joined: 12 Jul 17 Posts: 400 Credit: 13,821,664,882 RAC: 29,957,975 Level Scientific publications | |
Does anyone know if I need to install Miniconda and/or Anaconda to satisfy this error message? E.g.: https://conda.io/projects/conda/en/latest/user-guide/install/linux.html My Linux Mint Synaptic Package Manager can't find any program containing "conda." Maybe this is just something for the server-side staff but then why post an error message to confuse crunchers? | |
| ID: 59952 | Rating: 0 | rate:
| |
|
Richard Haselgrove Send message Joined: 11 Jul 09 Posts: 1589 Credit: 6,676,344,351 RAC: 9,081,515 Level Scientific publications | |
Maybe this is just something for the server-side staff but then why post an error message to confuse crunchers? It's not an error, it's simply a warning - information, if you like. The project supply the conda package (which is why Mint doesn't know about it), and they're obviously happy with the version they're using. You don't need to do anything. | |
| ID: 59953 | Rating: 0 | rate:
| |
|
Ian&Steve C. Send message Joined: 21 Feb 20 Posts: 1048 Credit: 40,228,383,983 RAC: 547,485 Level Scientific publications | |
even if you installed it, it wouldnt change anything and you'd get the same warning message. as Richard wrote, these tasks use its own environment. they do not use your locally installed conda at all. which is why they work on systems that do not have conda installed at all. this is all by design to avoid any version conflicts or dependencies on the local system. it has been this way from the beginning. additionally, this message was only present when trying to run the old/incompatible 4.01 app. you do not get that message from the correct 4.03 app. 4.01 was re-published by accident and is an app version about 1.5 years old. it is not compatible with the design/structure/requirements of how these tasks function today. the project admins have removed this version so you wont see this problem again. ____________ | |
| ID: 59954 | Rating: 0 | rate:
| |
|
Erich56 Send message Joined: 1 Jan 15 Posts: 1105 Credit: 7,822,620,176 RAC: 1,815,365 Level Scientific publications | |
|
what catches my eye: | |
| ID: 59955 | Rating: 0 | rate:
| |
|
KAMasud Send message Joined: 27 Jul 11 Posts: 137 Credit: 523,901,354 RAC: 0 Level Scientific publications | |
|
❸ Name Abouh Meaning | |
| ID: 59956 | Rating: 0 | rate:
| |
|
hi all, | |
| ID: 59957 | Rating: 0 | rate:
| |
|
Keith Myers Send message Joined: 13 Dec 17 Posts: 1313 Credit: 6,016,967,459 RAC: 9,922,728 Level Scientific publications | |
|
For Python, you don't need to worry about anything other than having 8-10 cpu cores to support the task. | |
| ID: 59958 | Rating: 0 | rate:
| |
|
Pop Piasa Send message Joined: 8 Aug 19 Posts: 252 Credit: 458,054,251 RAC: 0 Level Scientific publications | |
|
feri, If I might add to Keith Myers' excellent synopsis, the speed at which these tasks run appears more dependent upon CPU ability than GPU ability. You might want to consider that if you are thinking about assembling a host dedicated to running pythons and you maybe have an old GTX 1060 6GB or something else with sufficient VRAM (GTX1650) laying around. | |
| ID: 59959 | Rating: 0 | rate:
| |
|
..a friend of mine actualy has a gtx1060 6GB laying around | |
| ID: 59962 | Rating: 0 | rate:
| |
|
Keith Myers Send message Joined: 13 Dec 17 Posts: 1313 Credit: 6,016,967,459 RAC: 9,922,728 Level Scientific publications | |
|
Look at Richard Haselgrove's results with 6GB GTX 1060's | |
| ID: 59963 | Rating: 0 | rate:
| |
|
Richard Haselgrove Send message Joined: 11 Jul 09 Posts: 1589 Credit: 6,676,344,351 RAC: 9,081,515 Level Scientific publications | |
Look at Richard Haselgrove's results with 6GB GTX 1060's They're GTX 1660s, but 6 GB is right. They run fine on a setting of 3 CPUs + 1 GPU - a bit over 8 hours for the current jobs. | |
| ID: 59966 | Rating: 0 | rate:
| |
|
Relles Send message Joined: 1 Nov 17 Posts: 2 Credit: 14,338,075 RAC: 119,575 Level Scientific publications | |
|
I've noticed that on the same computer (with dual boot), tasks finish almost twice as fast on Ubuntu compared to Windows. I've tried running tasks on Linux only a few days ago and did so on Windows before. | |
| ID: 59982 | Rating: 0 | rate:
| |
|
Ian&Steve C. Send message Joined: 21 Feb 20 Posts: 1048 Credit: 40,228,383,983 RAC: 547,485 Level Scientific publications | |
|
They have always been faster on Linux | |
| ID: 59983 | Rating: 0 | rate:
| |
|
Erich56 Send message Joined: 1 Jan 15 Posts: 1105 Credit: 7,822,620,176 RAC: 1,815,365 Level Scientific publications | |
... tasks finish almost twice as fast on Ubuntu compared to Windows. I've tried running tasks on Linux only a few days ago and did so on Windows before. They have always been faster on Linux that's correct. What surprises me though is that tasks finish almost twice as fast. I don't think that this was true before, was it? | |
| ID: 59984 | Rating: 0 | rate:
| |
|
Relles Send message Joined: 1 Nov 17 Posts: 2 Credit: 14,338,075 RAC: 119,575 Level Scientific publications | |
|
Close to 10 hours are needed on Windows and almost six on Linux. I also find the difference striking, that's why I asked | |
| ID: 59985 | Rating: 0 | rate:
| |
|
STARBASEn Send message Joined: 17 Feb 09 Posts: 91 Credit: 1,603,303,394 RAC: 0 Level Scientific publications | |
|
Anyone having problems getting the ATM tasks to upload? I have 4 completed jobs on 3 machines trying to upload and have not been able to make contact for nearly a day now. Two tasks on one machine making that device unable to get any more work. | |
| ID: 59995 | Rating: 0 | rate:
| |
|
Greger Send message Joined: 6 Jan 15 Posts: 74 Credit: 18,046,599,749 RAC: 60,029,353 Level Scientific publications | |
|
Got several ATM stuck in upload there is now 2 days left to deadline. | |
| ID: 59996 | Rating: 0 | rate:
| |
|
Pop Piasa Send message Joined: 8 Aug 19 Posts: 252 Credit: 458,054,251 RAC: 0 Level Scientific publications | |
|
I've been watching the ATMs on the linux hosts (since they won't run on my windoze machines) to find a siderr file of a finished WU to study the linux (while I try to learn it). | |
| ID: 59997 | Rating: 0 | rate:
| |
|
Keith Myers Send message Joined: 13 Dec 17 Posts: 1313 Credit: 6,016,967,459 RAC: 9,922,728 Level Scientific publications | |
|
I had a couple of the ATM's finish successfully a week ago, but long cleared from the database for anyone to look at. | |
| ID: 59998 | Rating: 0 | rate:
| |
|
Greger Send message Joined: 6 Jan 15 Posts: 74 Credit: 18,046,599,749 RAC: 60,029,353 Level Scientific publications | |
|
Here is one completed Pop Piasa | |
| ID: 59999 | Rating: 0 | rate:
| |
|
Pop Piasa Send message Joined: 8 Aug 19 Posts: 252 Credit: 458,054,251 RAC: 0 Level Scientific publications | |
|
Thanks Greger, it's good to have a successful example to compare with when examining errors. I appreciate it. | |
| ID: 60000 | Rating: 0 | rate:
| |
|
KAMasud Send message Joined: 27 Jul 11 Posts: 137 Credit: 523,901,354 RAC: 0 Level Scientific publications | |
|
Windows here. You know, sometimes these WUs go to sleep, then I click the mouse and it starts running again. Not all WUs. | |
| ID: 60001 | Rating: 0 | rate:
| |
|
kotenok2000 Send message Joined: 18 Jul 13 Posts: 78 Credit: 16,175,793 RAC: 9,787 Level Scientific publications | |
|
Maybe you can change system power settings? | |
| ID: 60004 | Rating: 0 | rate:
| |
|
ngkachun1982 Send message Joined: 22 Apr 19 Posts: 3 Credit: 4,532,500 RAC: 6,518 Level Scientific publications | |
|
My recent results uploaded to GPUGRID often got "Error while computing" and lost all credits, I don't know why, what should I do ? | |
| ID: 60112 | Rating: 0 | rate:
| |
|
Keith Myers Send message Joined: 13 Dec 17 Posts: 1313 Credit: 6,016,967,459 RAC: 9,922,728 Level Scientific publications | |
|
You have to look at the errored task results on the website to find why you errored. | |
| ID: 60113 | Rating: 0 | rate:
| |
|
ngkachun1982 Send message Joined: 22 Apr 19 Posts: 3 Credit: 4,532,500 RAC: 6,518 Level Scientific publications | |
You have to look at the errored task results on the website to find why you errored. Thank you very much | |
| ID: 60118 | Rating: 0 | rate:
| |
|
KAMasud Send message Joined: 27 Jul 11 Posts: 137 Credit: 523,901,354 RAC: 0 Level Scientific publications | |
|
The server status shows WU's are available but my machines have received no task since yesterday. | |
| ID: 60125 | Rating: 0 | rate:
| |
|
abouh Project administrator Project developer Project tester Project scientist Send message Joined: 31 May 21 Posts: 200 Credit: 0 RAC: 0 Level Scientific publications | |
|
Hello! | |
| ID: 60127 | Rating: 0 | rate:
| |
|
ngkachun1982 Send message Joined: 22 Apr 19 Posts: 3 Credit: 4,532,500 RAC: 6,518 Level Scientific publications | |
|
I don't understand why my task fail, why ? | |
| ID: 60131 | Rating: 0 | rate:
| |
|
Ian&Steve C. Send message Joined: 21 Feb 20 Posts: 1048 Credit: 40,228,383,983 RAC: 547,485 Level Scientific publications | |
|
it's right in your message: | |
| ID: 60133 | Rating: 0 | rate:
| |
|
Erich56 Send message Joined: 1 Jan 15 Posts: 1105 Credit: 7,822,620,176 RAC: 1,815,365 Level Scientific publications | |
|
I am experiencing a strange problem on my PC with two RTX3070 inside, CPU Intel i9-10900KF (10 cores/20 threads), 128 GB RAM: | |
| ID: 60298 | Rating: 0 | rate:
| |
|
Keith Myers Send message Joined: 13 Dec 17 Posts: 1313 Credit: 6,016,967,459 RAC: 9,922,728 Level Scientific publications | |
|
Consequence of running the acemd3 and ATM tasks is that it dropped your APR rate on the host and now the client thinks that you will not be able to finish the second Python task before deadline. | |
| ID: 60299 | Rating: 0 | rate:
| |
|
Erich56 Send message Joined: 1 Jan 15 Posts: 1105 Credit: 7,822,620,176 RAC: 1,815,365 Level Scientific publications | |
|
thank you, Keith, for the explanation :-) | |
| ID: 60300 | Rating: 0 | rate:
| |
|
KAMasud Send message Joined: 27 Jul 11 Posts: 137 Credit: 523,901,354 RAC: 0 Level Scientific publications | |
|
Absolutely no usage of GPU only CPU. | |
| ID: 60345 | Rating: 0 | rate:
| |
|
Ian&Steve C. Send message Joined: 21 Feb 20 Posts: 1048 Credit: 40,228,383,983 RAC: 547,485 Level Scientific publications | |
|
for the first 5 minutes or so, there will only be CPU use and no GPU use because the task is extracting the python environment to the designated slot. after this, the task will run and start using both GPU and CPU. GPU use will be low. | |
| ID: 60346 | Rating: 0 | rate:
| |
|
KAMasud Send message Joined: 27 Jul 11 Posts: 137 Credit: 523,901,354 RAC: 0 Level Scientific publications | |
|
No, it was not at 5% but 29% and stuck. I exited BOINC and restarted. The WU is now normal at 34%. | |
| ID: 60347 | Rating: 0 | rate:
| |
|
Ian&Steve C. Send message Joined: 21 Feb 20 Posts: 1048 Credit: 40,228,383,983 RAC: 547,485 Level Scientific publications | |
|
i said 5 minutes not 5%. | |
| ID: 60348 | Rating: 0 | rate:
| |
|
kotenok2000 Send message Joined: 18 Jul 13 Posts: 78 Credit: 16,175,793 RAC: 9,787 Level Scientific publications | |
|
It is 20 minutes on my hdd. | |
| ID: 60349 | Rating: 0 | rate:
| |
|
KAMasud Send message Joined: 27 Jul 11 Posts: 137 Credit: 523,901,354 RAC: 0 Level Scientific publications | |
i said 5 minutes not 5%. ____________-- Chill, bro. Completed and validated. | |
| ID: 60350 | Rating: 0 | rate:
| |
|
Ian&Steve C. Send message Joined: 21 Feb 20 Posts: 1048 Credit: 40,228,383,983 RAC: 547,485 Level Scientific publications | |
It is 20 minutes on my hdd. that makes sense for a slower device like a HDD. ____________ | |
| ID: 60351 | Rating: 0 | rate:
| |
|
Erich56 Send message Joined: 1 Jan 15 Posts: 1105 Credit: 7,822,620,176 RAC: 1,815,365 Level Scientific publications | |
|
Is the Python project dead ? | |
| ID: 60709 | Rating: 0 | rate:
| |
|
Keith Myers Send message Joined: 13 Dec 17 Posts: 1313 Credit: 6,016,967,459 RAC: 9,922,728 Level Scientific publications | |
Is the Python project dead ? Could be. Haven't seen the researcher behind those task types around for quite a while. Could be he has moved on or maybe just taking a summer sabbatical or something. | |
| ID: 60710 | Rating: 0 | rate:
| |


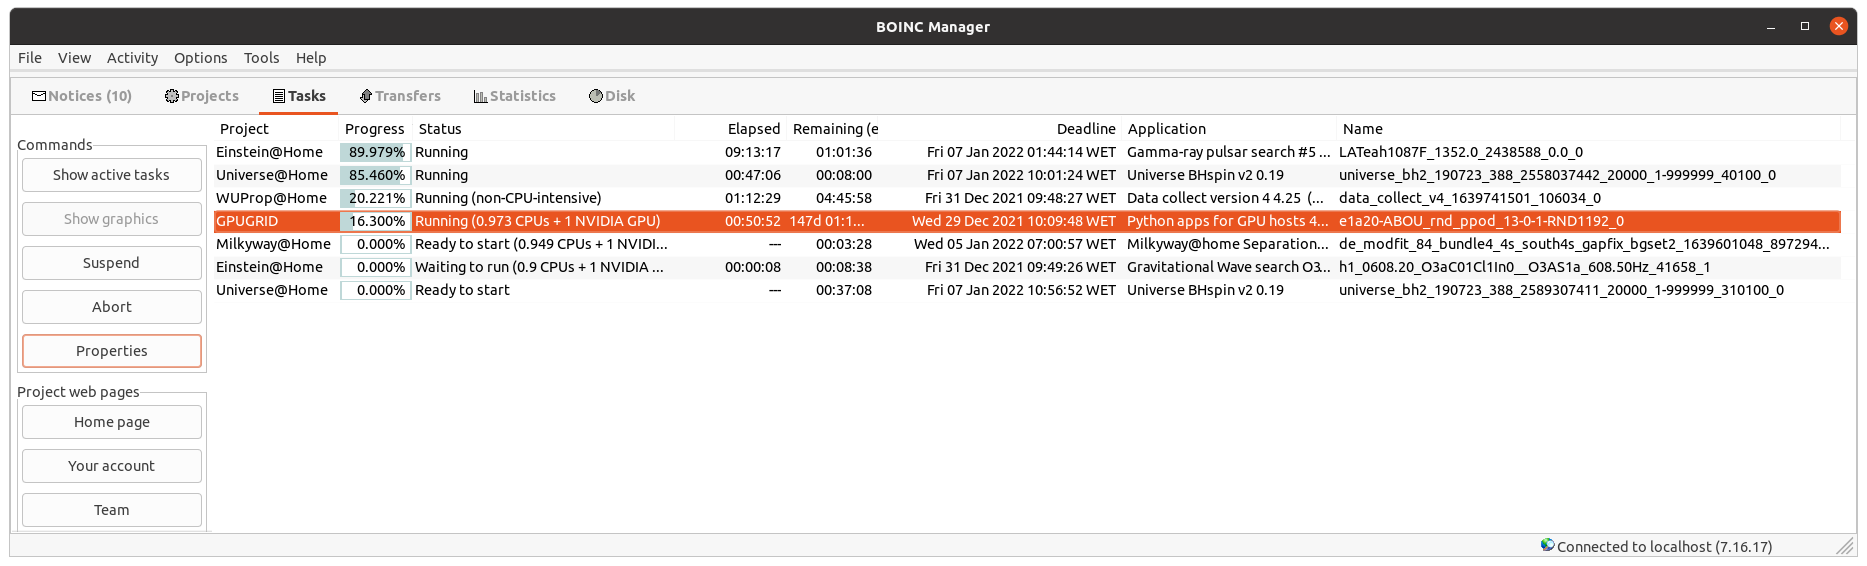
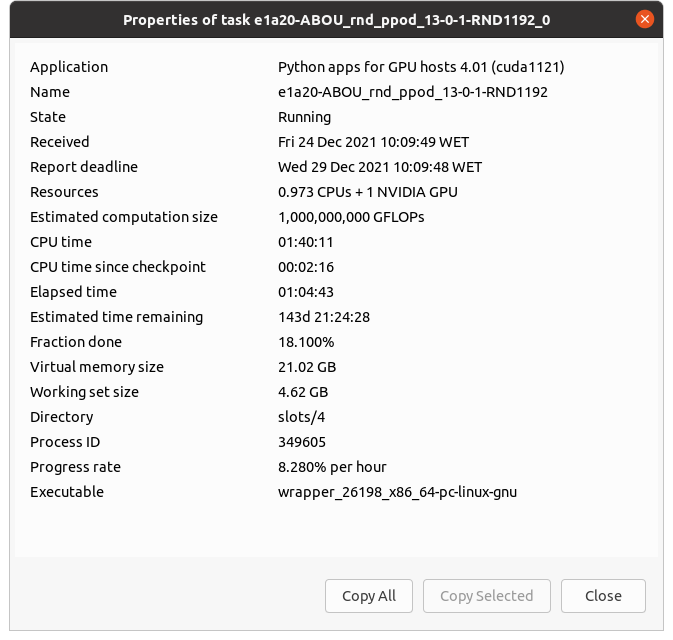
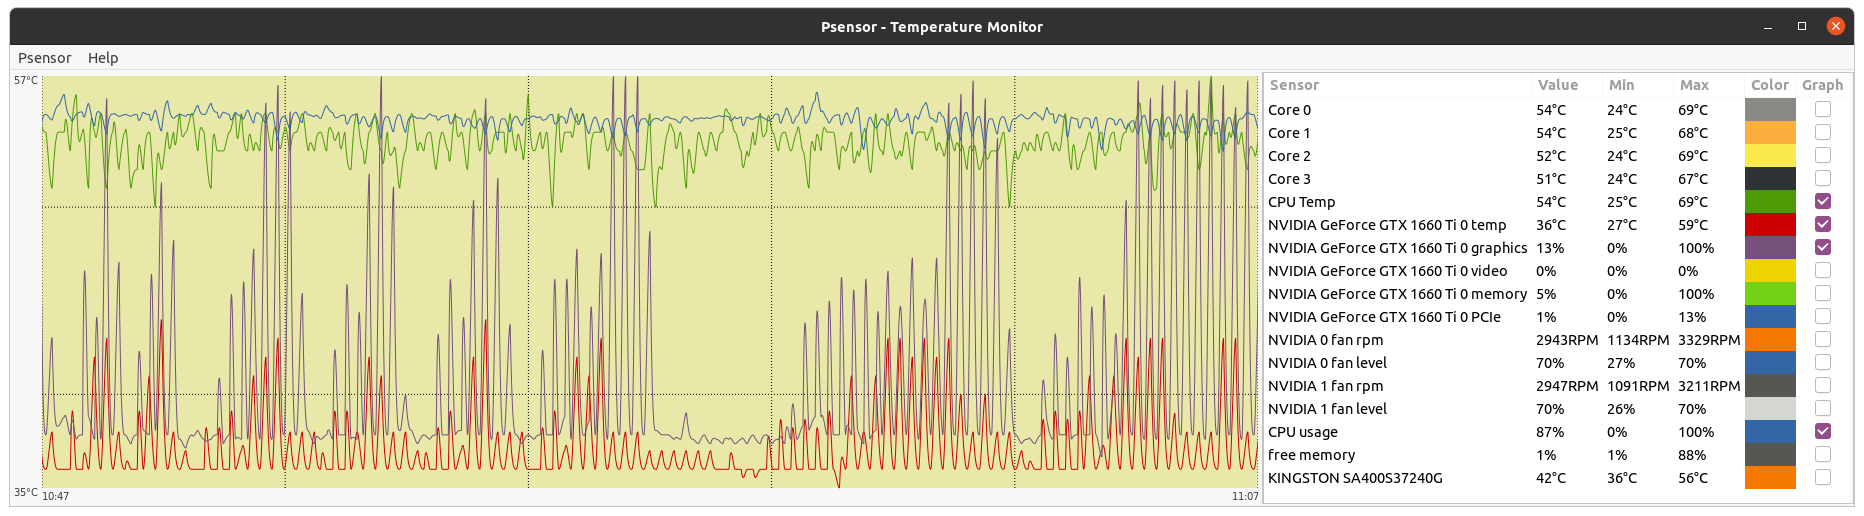
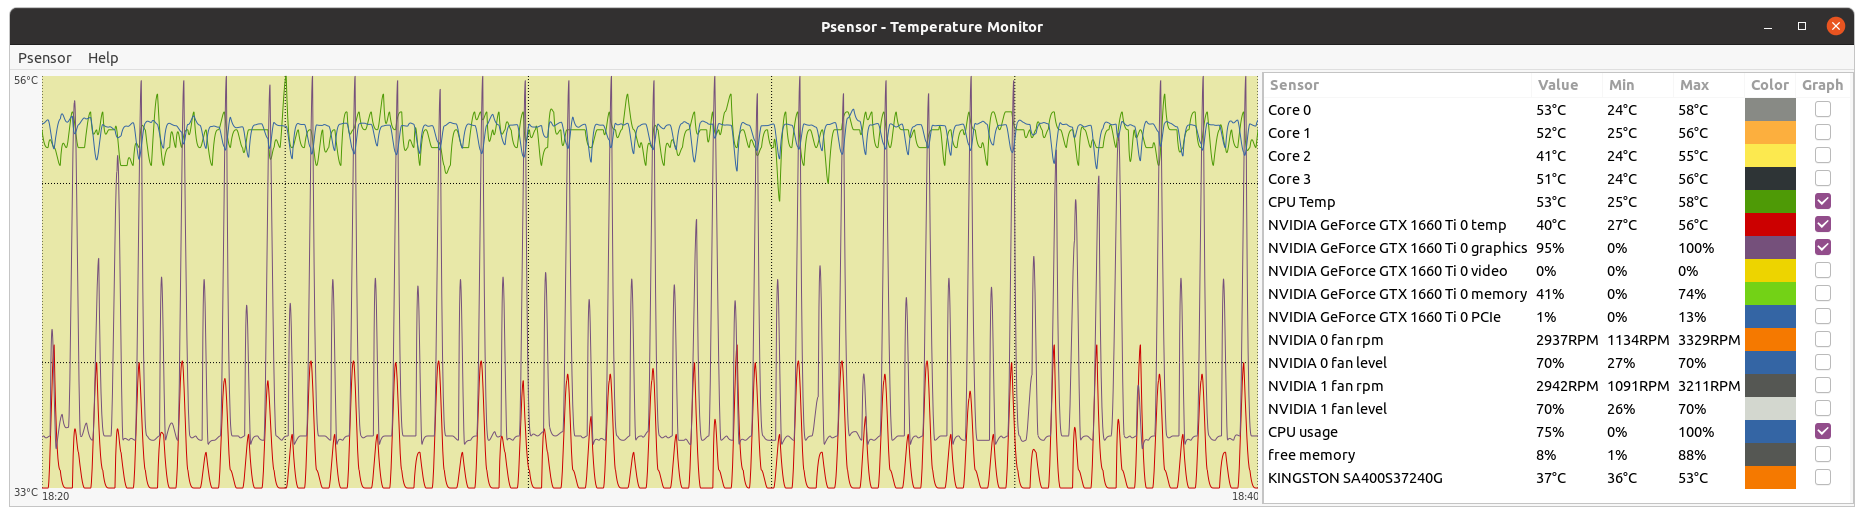
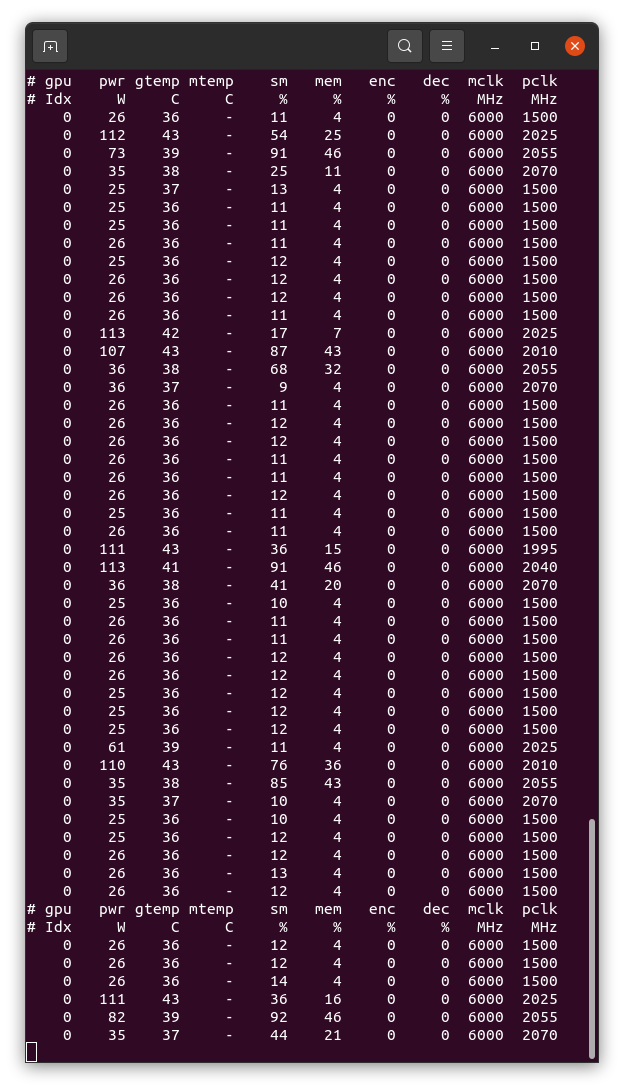
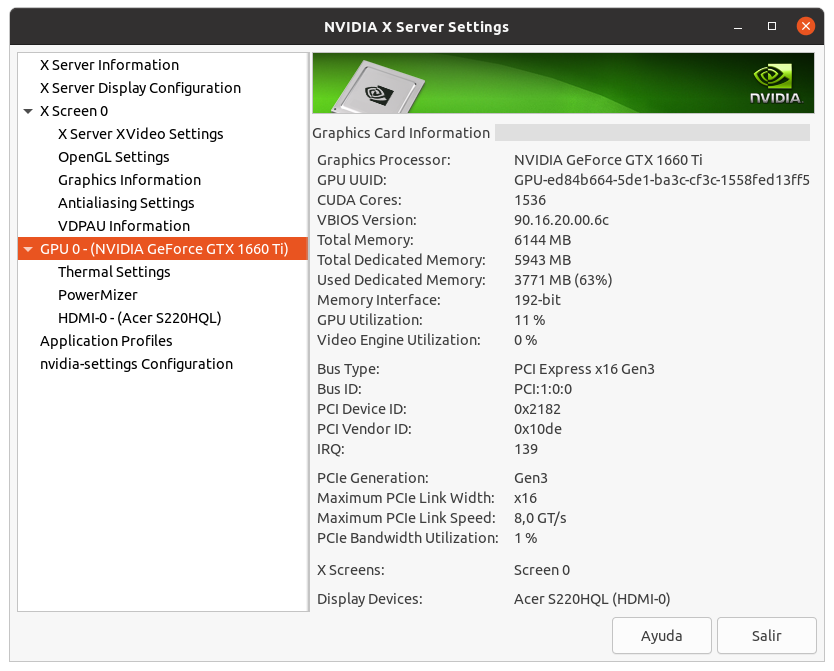
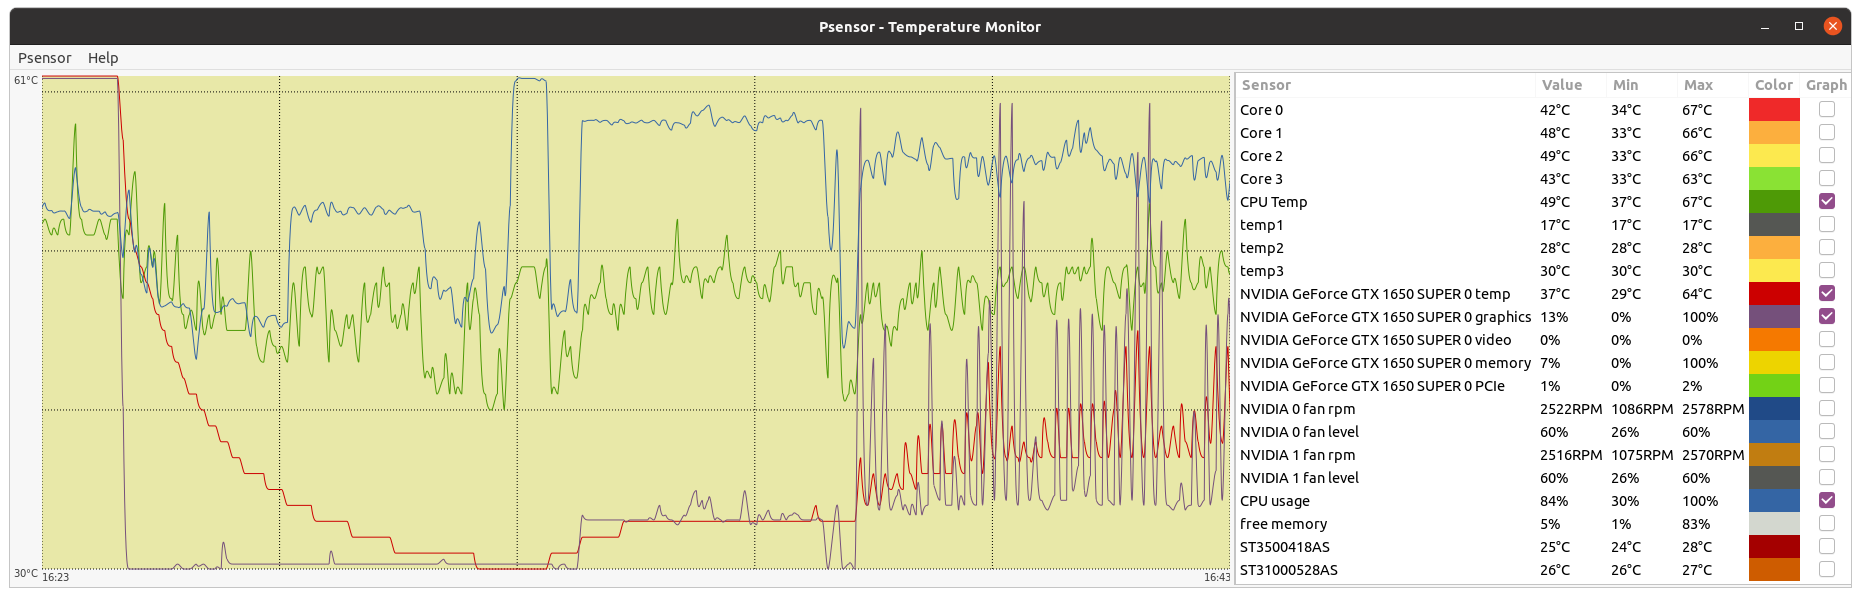
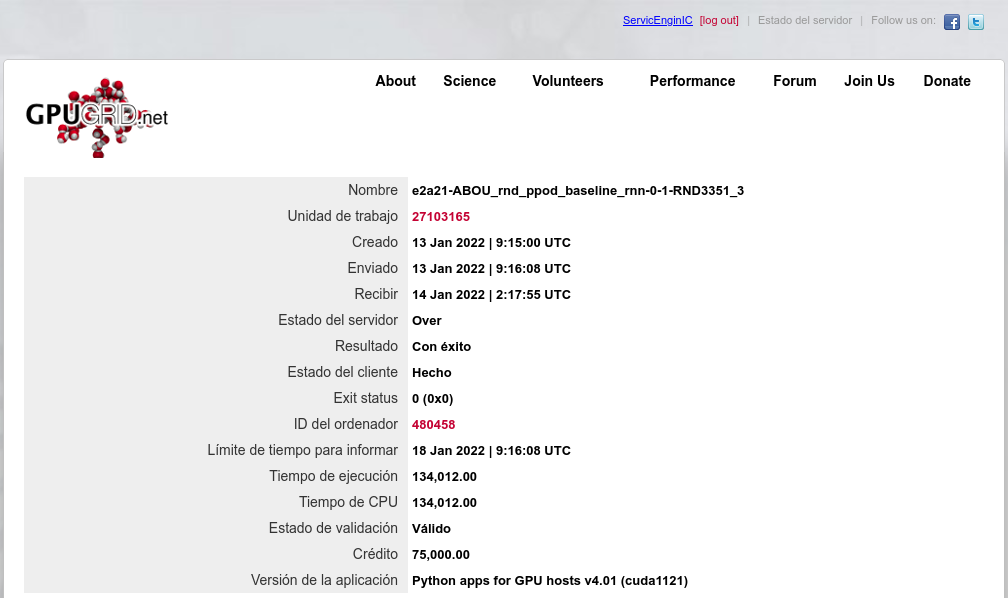
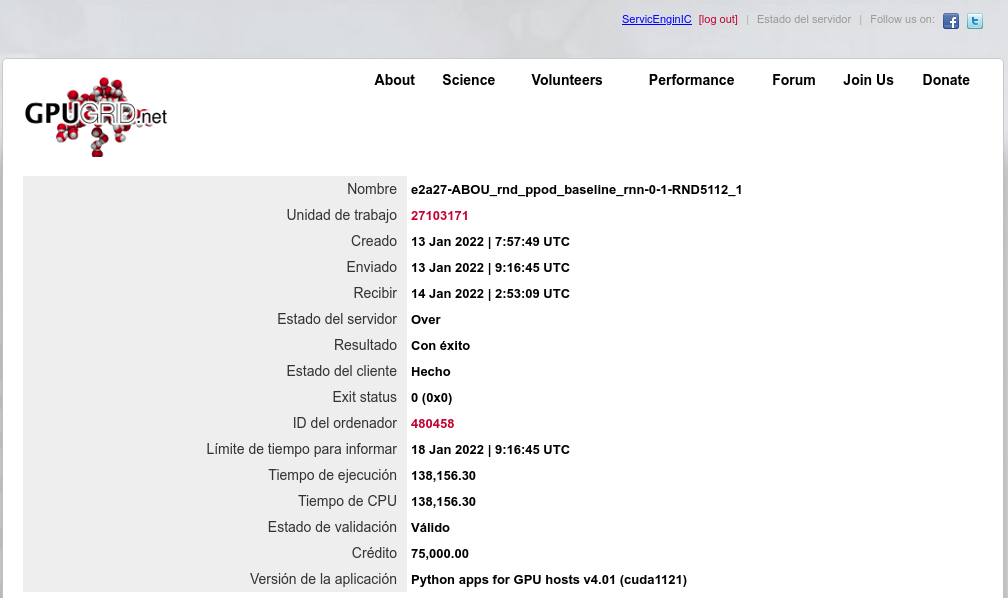
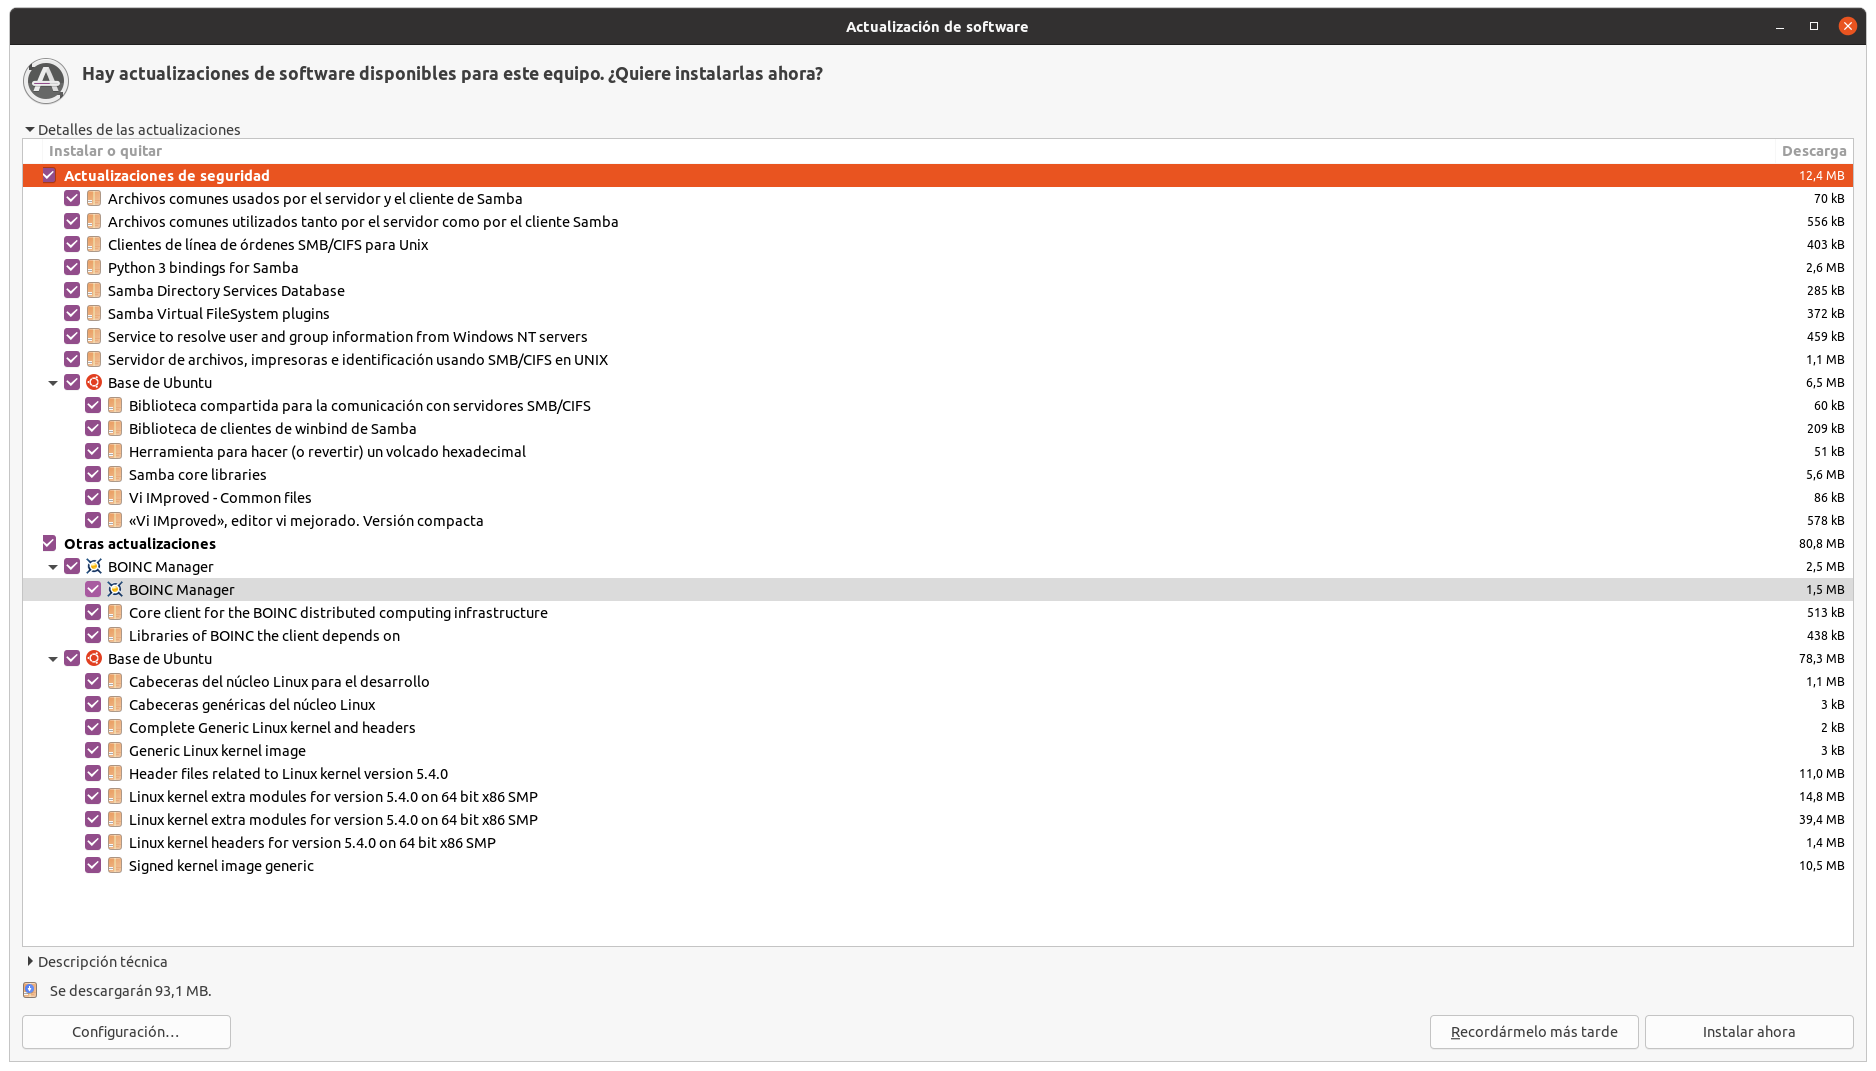
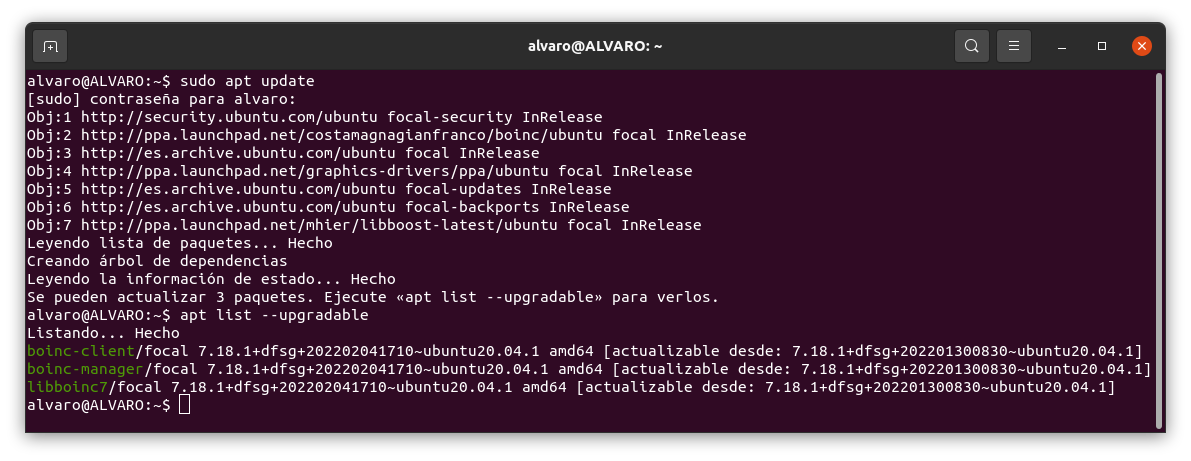
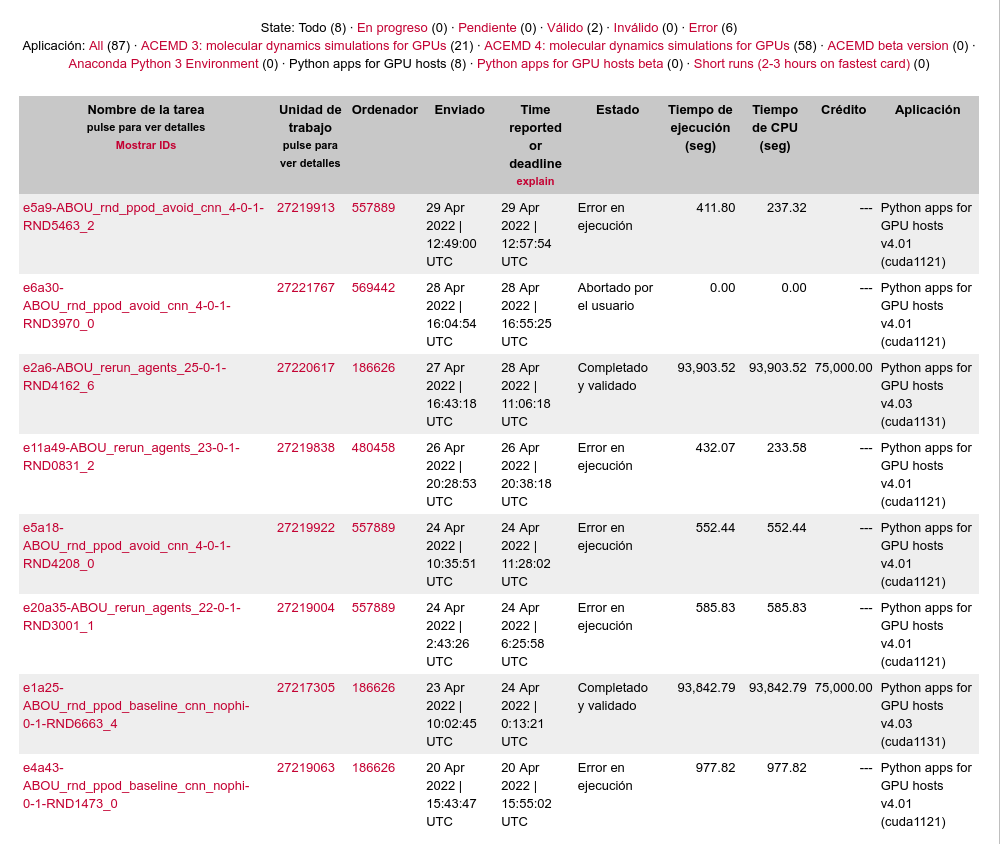
Message boards : News : Experimental Python tasks (beta) - task description