Message boards : News : New workunits
| Author | Message |
|---|---|
|
Toni Volunteer moderator Project administrator Project developer Project tester Project scientist Send message Joined: 9 Dec 08 Posts: 1006 Credit: 5,068,599 RAC: 0 Level Scientific publications | |
|
I'm loading a first batch of 1000 workunits for a new project (GSN*) on the acemd3 app. This batch is both for a basic science investigation, and for load-testing the app. Thanks! | |
| ID: 53010 | Rating: 0 | rate:
| |
 [PUGLIA] kidkidkid3 [PUGLIA] kidkidkid3Send message Joined: 23 Feb 11 Posts: 94 Credit: 1,004,605,544 RAC: 187,550 Level Scientific publications | |
|
Hi, | |
| ID: 53011 | Rating: 0 | rate:
| |
|
jjch Send message Joined: 10 Nov 13 Posts: 98 Credit: 15,429,700,388 RAC: 174,090 Level Scientific publications | |
|
Thank you Toni! | |
| ID: 53012 | Rating: 0 | rate:
| |
|
jjch Send message Joined: 10 Nov 13 Posts: 98 Credit: 15,429,700,388 RAC: 174,090 Level Scientific publications | |
Hi, [PUGLIA] kidkidkid3 It would help a lot to know what your setup looks like. Your computers are hidden so we can't see them. Also, the configuration may make a difference Please provide some details. | |
| ID: 53013 | Rating: 0 | rate:
| |
|
[PUGLIA] kidkidkid3 Send message Joined: 23 Feb 11 Posts: 94 Credit: 1,004,605,544 RAC: 187,550 Level Scientific publications | |
|
Sorry for mistake of configuration | |
| ID: 53014 | Rating: 0 | rate:
| |
|
jjch Send message Joined: 10 Nov 13 Posts: 98 Credit: 15,429,700,388 RAC: 174,090 Level Scientific publications | |
Sorry for mistake of configuration ... here the log. OK so I can check on the link to the computer and I see you have 2x GTX 750 Ti's http://www.gpugrid.net/show_host_detail.php?hostid=208691 I'm not sure a GTX 750 series can run the new app. Let's see if one of the resident experts will know the answer. | |
| ID: 53015 | Rating: 0 | rate:
| |
|
Erich56 Send message Joined: 1 Jan 15 Posts: 1105 Credit: 7,822,620,176 RAC: 1,815,365 Level Scientific publications | |
I'm not sure a GTX 750 series can run the new app. Let's see if one of the resident experts will know the answer. the strange thing with my hosts here is that the host with the GTX980ti and the host with the GTX970 received the new ACEMD v2.10 tasks this evening, but the two hosts with a GTX750ti did NOT. Was this coincidence, or is the new version not being sent to GTX750ti cards? | |
| ID: 53016 | Rating: 0 | rate:
| |
|
ServicEnginIC Send message Joined: 24 Sep 10 Posts: 572 Credit: 7,516,447,024 RAC: 10,464,686 Level Scientific publications | |
I'm not sure a GTX 750 series can run the new app I can confirm that I've finished successfully ACEMD3 test tasks on GTX750 and GTX750Ti graphics cards running under Linux OS. I can also remark that I had some troubles under Windows 10 regarding some Antivirus interference. This was commented at following thread: http://www.gpugrid.net/forum_thread.php?id=4999 | |
| ID: 53017 | Rating: 0 | rate:
| |
|
ServicEnginIC Send message Joined: 24 Sep 10 Posts: 572 Credit: 7,516,447,024 RAC: 10,464,686 Level Scientific publications | |
Was this coincidence, or is the new version not being sent to GTX750ti cards? Please, try updating drivers | |
| ID: 53018 | Rating: 0 | rate:
| |
|
Greg _BE Send message Joined: 30 Jun 14 Posts: 127 Credit: 110,756,939 RAC: 4,306 Level Scientific publications | |
|
Just starting a task on my GTX 1050TI (fully updated drivers, no overdrive, default settings) | |
| ID: 53020 | Rating: 0 | rate:
| |
|
Pop Piasa Send message Joined: 8 Aug 19 Posts: 252 Credit: 458,054,251 RAC: 0 Level Scientific publications | |
|
Hi, I'm running test 309 on an i7-860 with one GTX 750Ti and ACEMD 3 test is reporting 4.680%/Hr. | |
| ID: 53021 | Rating: 0 | rate:
| |
|
STARBASEn Send message Joined: 17 Feb 09 Posts: 91 Credit: 1,603,303,394 RAC: 0 Level Scientific publications | |
|
I got this one today http://www.gpugrid.net/workunit.php?wuid=16850979 and it ran fine. As I've said before, Linux machines are quite ready. | |
| ID: 53022 | Rating: 0 | rate:
| |
|
Keith Myers  Send message Joined: 13 Dec 17 Posts: 1313 Credit: 6,018,992,459 RAC: 10,024,692 Level Scientific publications | |
|
Three finished so far, working on a fourth. Keep 'em coming. | |
| ID: 53023 | Rating: 0 | rate:
| |
|
KAMasud Send message Joined: 27 Jul 11 Posts: 137 Credit: 523,901,354 RAC: 0 Level Scientific publications | |
|
Got one task. GTX1060 with Max-Q. Windows 10. Task errored out. Following is the complete story. | |
| ID: 53025 | Rating: 0 | rate:
| |
|
rod4x4 Send message Joined: 4 Aug 14 Posts: 266 Credit: 2,219,935,054 RAC: 0 Level Scientific publications | |
I'm not sure a GTX 750 series can run the new app. I have a GTX 750 on a linux host that is processing an ACEMD3 task, it is about half way through and should complete the task in about 1 day. A Win7 host with GTX 750 ti is also processing an ACEMD3 task. This should take 20 hours. On a Win7 host with GTX 960, two ACEMD3 tasks have failed. Both with this error: # Engine failed: Particle coordinate is nan Host can be found here: http://gpugrid.net/results.php?hostid=274119 What I have noticed on my Linux hosts is nvidia-smi reports the ACEMD3 tasks are using 10% more power than the ACEMD2 tasks. This would indicate that the ACEMD3 tasks are more efficient at pushing the GPU to it's full potential. Because of this, I have reduced the overclocking on some hosts (particularly the GTX 960 above) | |
| ID: 53026 | Rating: 0 | rate:
| |
|
Erich56 Send message Joined: 1 Jan 15 Posts: 1105 Credit: 7,822,620,176 RAC: 1,815,365 Level Scientific publications | |
Was this coincidence, or is the new version not being sent to GTX750ti cards? would be useful if we were told which is the minimum required version number of the driver. | |
| ID: 53027 | Rating: 0 | rate:
| |
|
rod4x4 Send message Joined: 4 Aug 14 Posts: 266 Credit: 2,219,935,054 RAC: 0 Level Scientific publications | |
would be useful if we were told which is the minimum required version number of the driver. This info can be found here: http://gpugrid.net/forum_thread.php?id=5002 | |
| ID: 53028 | Rating: 0 | rate:
| |
|
Erich56 Send message Joined: 1 Jan 15 Posts: 1105 Credit: 7,822,620,176 RAC: 1,815,365 Level Scientific publications | |
would be useful if we were told which is the minimum required version number of the driver. oh, thanks very much; so all is clear now - I need to update my drivers on the two GTX750ti hosts. | |
| ID: 53029 | Rating: 0 | rate:
| |
|
rod4x4 Send message Joined: 4 Aug 14 Posts: 266 Credit: 2,219,935,054 RAC: 0 Level Scientific publications | |
Hi, I'm running test 309 on an i7-860 with one GTX 750Ti and ACEMD 3 test is reporting 4.680%/Hr. The gtx 1060 performance seems fine for the ACEMD2 task in your task list. May find some clues to the slow ACEMD3 performance in the Stderr output when task completes. The ACEMD3 task progress reporting is not as accurate as the ACEMD2 tasks, a side affect of using a Wrapper. So the performance should only be judged when it has completed. | |
| ID: 53031 | Rating: 0 | rate:
| |
|
Erich56 Send message Joined: 1 Jan 15 Posts: 1105 Credit: 7,822,620,176 RAC: 1,815,365 Level Scientific publications | |
would be useful if we were told which is the minimum required version number of the driver. Driver updates complete, and 1 of my 2 GTX750ti has already received a task, it's running well. What I noticed, also on the other hosts (GTX980ti and GTX970), is that the GPU usage (as shown in the NVIDIA Inspector and GPU-Z) now is up to 99% most of the time; this was not the case before, most probably due to the WDDM "brake" in Win7 and Win10 (it was at 99% in WinXP which had no WDDM). And this is noticable, as the new software seems to have overcome this problem. | |
| ID: 53032 | Rating: 0 | rate:
| |
|
rod4x4 Send message Joined: 4 Aug 14 Posts: 266 Credit: 2,219,935,054 RAC: 0 Level Scientific publications | |
Driver updates complete, and 1 of my 2 GTX750ti has already received a task, it's running well. Good News! What I noticed, also on the other hosts (GTX980ti and GTX970), is that the GPU usage (as shown in the NVIDIA Inspector and GPU-Z) now is up to 99% most of the time; this was not the case before, most probably due to the WDDM "brake" in Win7 and Win10 (it was at 99% in WinXP which had no WDDM). The ACEMD3 performance is impressive. Toni did indicate that the performance using the Wrapper will be better (here: http://gpugrid.net/forum_thread.php?id=4935&nowrap=true#51939)...and he is right! Toni (and GPUgrid team) set out with a vision to make the app more portable and faster. They have delivered. Thank you Toni (and GPUgrid team). | |
| ID: 53034 | Rating: 0 | rate:
| |
|
Greg _BE Send message Joined: 30 Jun 14 Posts: 127 Credit: 110,756,939 RAC: 4,306 Level Scientific publications | |
|
http://www.gpugrid.net/result.php?resultid=21502590 | |
| ID: 53036 | Rating: 0 | rate:
| |
|
Erich56 Send message Joined: 1 Jan 15 Posts: 1105 Credit: 7,822,620,176 RAC: 1,815,365 Level Scientific publications | |
Toni (and GPUgrid team) set out with a vision to make the app more portable and faster. They have delivered. Thank you Toni (and GPUgrid team). + 1 | |
| ID: 53037 | Rating: 0 | rate:
| |
|
rod4x4 Send message Joined: 4 Aug 14 Posts: 266 Credit: 2,219,935,054 RAC: 0 Level Scientific publications | |
http://www.gpugrid.net/result.php?resultid=21502590 The memory leaks do appear on startup, probably not critical errors. The issue in your case is ACEMD3 tasks cannot start on one GPU and be resumed on another. From your STDerr Output: ..... 04:26:56 (8564): wrapper: running acemd3.exe (--boinc input --device 0) ..... 06:08:12 (16628): wrapper: running acemd3.exe (--boinc input --device 1) ERROR: src\mdsim\context.cpp line 322: Cannot use a restart file on a different device! It was started on Device 0 but failed when it was resumed on Device 1 Refer this FAQ post by Toni for further clarification: http://www.gpugrid.net/forum_thread.php?id=5002 | |
| ID: 53038 | Rating: 0 | rate:
| |
|
Toni Volunteer moderator Project administrator Project developer Project tester Project scientist Send message Joined: 9 Dec 08 Posts: 1006 Credit: 5,068,599 RAC: 0 Level Scientific publications | |
|
Thanks to all! To summarize some responses of the feedback above: | |
| ID: 53039 | Rating: 0 | rate:
| |
|
Erich56 Send message Joined: 1 Jan 15 Posts: 1105 Credit: 7,822,620,176 RAC: 1,815,365 Level Scientific publications | |
|
Toni, since the new app is an obvious success - now the inevitable question: when will you send out the next batch of tasks? | |
| ID: 53040 | Rating: 0 | rate:
| |
|
rod4x4 Send message Joined: 4 Aug 14 Posts: 266 Credit: 2,219,935,054 RAC: 0 Level Scientific publications | |
|
Hi Toni "Memory leaks": ignore the message, it's always there. The actual error, if present, is at the top. I am not seeing the error at the top, am I missing it? All I find is the generic Wrapper error message stating there is an Error in the Client task. The task error is buried in the STDerr Output. Can the task error be passed to the Wrapper Error code? | |
| ID: 53041 | Rating: 0 | rate:
| |
|
Toni Volunteer moderator Project administrator Project developer Project tester Project scientist Send message Joined: 9 Dec 08 Posts: 1006 Credit: 5,068,599 RAC: 0 Level Scientific publications | |
|
@rod4x4 which error? no resume on different cards is known, please see the faq. | |
| ID: 53042 | Rating: 0 | rate:
| |
|
San-Fernando-Valley Send message Joined: 16 Jan 17 Posts: 8 Credit: 27,984,427 RAC: 0 Level Scientific publications | |
|
WAITING FOR WU's | |
| ID: 53043 | Rating: 0 | rate:
| |
|
Greg _BE Send message Joined: 30 Jun 14 Posts: 127 Credit: 110,756,939 RAC: 4,306 Level Scientific publications | |
|
oh interesting. | |
| ID: 53044 | Rating: 0 | rate:
| |
|
Greg _BE Send message Joined: 30 Jun 14 Posts: 127 Credit: 110,756,939 RAC: 4,306 Level Scientific publications | |
|
Why is CPU usage so high? | |
| ID: 53045 | Rating: 0 | rate:
| |
|
jp de malo Send message Joined: 3 Jun 10 Posts: 4 Credit: 1,787,743,243 RAC: 238,269 Level Scientific publications | |
|
c'est déja fini le test aucune erreur sur mes 1050ti et sur ma 1080ti | |
| ID: 53046 | Rating: 0 | rate:
| |
|
Toni Volunteer moderator Project administrator Project developer Project tester Project scientist Send message Joined: 9 Dec 08 Posts: 1006 Credit: 5,068,599 RAC: 0 Level Scientific publications | |
oh interesting. See faq, you can restrict usable gpus. | |
| ID: 53047 | Rating: 0 | rate:
| |
|
Keith Myers Send message Joined: 13 Dec 17 Posts: 1313 Credit: 6,018,992,459 RAC: 10,024,692 Level Scientific publications | |
http://www.gpugrid.net/result.php?resultid=21502590 Solve the issue of stopping processing one type of card and attempting to finish on another type of card by changing your compute preferences of "switch between tasks every xx minutes" to a larger value than the default 60. Change to a value that will allow the task to finish on your slowest card. I suggest 360-640 minutes depending on your hardware. | |
| ID: 53048 | Rating: 0 | rate:
| |
|
Toni Volunteer moderator Project administrator Project developer Project tester Project scientist Send message Joined: 9 Dec 08 Posts: 1006 Credit: 5,068,599 RAC: 0 Level Scientific publications | |
|
I'm looking for a confirmation that the app works on windows machine with > 1 device. I'm seeing some 7:33:28 (10748): wrapper: running acemd3.exe (--boinc input --device 2) # Engine failed: Illegal value for DeviceIndex: 2 | |
| ID: 53049 | Rating: 0 | rate:
| |
|
Keith Myers Send message Joined: 13 Dec 17 Posts: 1313 Credit: 6,018,992,459 RAC: 10,024,692 Level Scientific publications | |
Why is CPU usage so high? Because that is the way the gpu application and wrapper requires. The science application is faster and needs a constant supply of data fed to it by the cpu thread because of higher gpu utilization. The tasks finish in 1/3 to 1/2 the time that the old acemd2 app needed. | |
| ID: 53051 | Rating: 0 | rate:
| |
|
Keith Myers Send message Joined: 13 Dec 17 Posts: 1313 Credit: 6,018,992,459 RAC: 10,024,692 Level Scientific publications | |
Thanks to all! To summarize some responses of the feedback above: Toni, new features are available for CUDA-MEMCHECK in CUDA10.2. The CUDA-MEMCHECK tool seems useful. It can be called against the application with: cuda-memcheck [memcheck_options] app_name [app_options] https://docs.nvidia.com/cuda/cuda-memcheck/index.html#memcheck-tool | |
| ID: 53052 | Rating: 0 | rate:
| |
|
Erich56 Send message Joined: 1 Jan 15 Posts: 1105 Credit: 7,822,620,176 RAC: 1,815,365 Level Scientific publications | |
I'm looking for a confirmation that the app works on windows machine with > 1 device. I'm seeing some In one of my hosts I have 2 GTX980Ti. However, one of them I have excluded from GPUGRID via cc_config.xml since one of the fans became defective. But with regard to your request, I guess this does not matter. At any rate, the other GPU processes the new app perfectly. | |
| ID: 53053 | Rating: 0 | rate:
| |
|
Greg _BE Send message Joined: 30 Jun 14 Posts: 127 Credit: 110,756,939 RAC: 4,306 Level Scientific publications | |
http://www.gpugrid.net/result.php?resultid=21502590 360 is already where it is at since I also run LHC ATLAS and that does not like to be disturbed and usually finishes in 6 hrs. I added a cc_config file to force your project to use just the 1050. I will double check my placement a bit later. | |
| ID: 53054 | Rating: 0 | rate:
| |
|
Aurum Send message Joined: 12 Jul 17 Posts: 400 Credit: 13,832,764,882 RAC: 30,787,057 Level Scientific publications | |
|
The %Progress keeps resetting to zero on 2080 Ti's but seems normal on 1080 Ti's. | |
| ID: 53055 | Rating: 0 | rate:
| |
|
Richard Haselgrove Send message Joined: 11 Jul 09 Posts: 1589 Credit: 6,677,394,351 RAC: 9,116,452 Level Scientific publications | |
I'm looking for a confirmation that the app works on windows machine with > 1 device. I'm seeing some I'm currently running test340-TONI_GSNTEST3-3-100-RND9632_0 on a GTX 1660 SUPER under Windows 7, BOINC v7.16.3 The machine has a secondary GPU, but is running on the primary: command line looks correct, as "acemd3.exe" --boinc input --device 0 Progress is displaying plausibly as 50.000% after 2 hours 22 minutes, updating in 1% increments only. | |
| ID: 53056 | Rating: 0 | rate:
| |
|
Richard Haselgrove Send message Joined: 11 Jul 09 Posts: 1589 Credit: 6,677,394,351 RAC: 9,116,452 Level Scientific publications | |
|
Task completed and validated. | |
| ID: 53057 | Rating: 0 | rate:
| |
|
Aurum Send message Joined: 12 Jul 17 Posts: 400 Credit: 13,832,764,882 RAC: 30,787,057 Level Scientific publications | |
The %Progress keeps resetting to zero on 2080 Ti's but seems normal on 1080 Ti's.My impression so far is that Win7-64 can run four WUs on two 1080 Ti's fine on the same computer fine. The problem seems to be with 2080 Ti's running on Win7-64. I'm running four WUs on one 2080 Ti with four Einstein or four Milkyway on the second 2080 Ti seems ok so far. Earlier when I had two WUs on each 2080 Ti along with either two Einstein or two Milkyway that it kept resetting. All Linux computers with 1080 Ti's seem normal. Plan to move my two 2080 Ti's back to a Linux computer and try that. ____________  | |
| ID: 53058 | Rating: 0 | rate:
| |
|
rod4x4 Send message Joined: 4 Aug 14 Posts: 266 Credit: 2,219,935,054 RAC: 0 Level Scientific publications | |
The %Progress keeps resetting to zero on 2080 Ti's but seems normal on 1080 Ti's.My impression so far is that Win7-64 can run four WUs on two 1080 Ti's fine on the same computer fine. As a single ACEMD3 task can push the GPU to 100%, it would be interesting to see if there is any clear advantage to running multiple ACEMD3 tasks on a GPU. | |
| ID: 53059 | Rating: 0 | rate:
| |
|
rod4x4 Send message Joined: 4 Aug 14 Posts: 266 Credit: 2,219,935,054 RAC: 0 Level Scientific publications | |
@rod4x4 which error? no resume on different cards is known, please see the faq. Hi Toni Not referring to any particular error. When the ACEMD3 task (Child task) experiences an error, the Wrapper always reports a generic error (195) in the Exit Status: Exit status 195 (0xc3) EXIT_CHILD_FAILED Can the specific (Child) task error be passed to the Exit Status? | |
| ID: 53060 | Rating: 0 | rate:
| |
|
KAMasud Send message Joined: 27 Jul 11 Posts: 137 Credit: 523,901,354 RAC: 0 Level Scientific publications | |
|
Okay, my 1060 with Max-Q design completed one task and validated. | |
| ID: 53061 | Rating: 0 | rate:
| |
|
rod4x4 Send message Joined: 4 Aug 14 Posts: 266 Credit: 2,219,935,054 RAC: 0 Level Scientific publications | |
Okay, my 1060 with Max-Q design completed one task and validated. Good news. Did you make any changes to the config after the first failure? | |
| ID: 53062 | Rating: 0 | rate:
| |
|
Bedrich Hajek Send message Joined: 28 Mar 09 Posts: 477 Credit: 9,338,822,716 RAC: 10,910,487 Level Scientific publications | |
|
My windows 10 computer on the RTX 2080 ti is finishing these WUs in about 6100 seconds, which is about the same time as computers running linux with same card. | |
| ID: 53065 | Rating: 0 | rate:
| |
|
KAMasud Send message Joined: 27 Jul 11 Posts: 137 Credit: 523,901,354 RAC: 0 Level Scientific publications | |
|
@Rod 4*4. I did make a change but I do not know it's relevance. I set SWAN_SYNC to 0. I did that for some other reason. Anyway, second WU completed and validated. | |
| ID: 53066 | Rating: 0 | rate:
| |
|
Erich56 Send message Joined: 1 Jan 15 Posts: 1105 Credit: 7,822,620,176 RAC: 1,815,365 Level Scientific publications | |
Is the WDDM lag gone or is it my imagination? Given that the various tool now show a GPU utilization of mostly up to 99% or even 100% (as it was with WinXP before), it would seem to me that the WDDM does not play a role any more. | |
| ID: 53069 | Rating: 0 | rate:
| |
|
eXaPower Send message Joined: 25 Sep 13 Posts: 293 Credit: 1,897,601,978 RAC: 0 Level Scientific publications | |
|
WU now require 1 CPU core - WU run slower on 4/5 GPUs with (4) CPU cores. | |
| ID: 53070 | Rating: 0 | rate:
| |
|
Retvari Zoltan Send message Joined: 20 Jan 09 Posts: 2343 Credit: 16,201,255,749 RAC: 0 Level Scientific publications | |
My windows 10 computer on the RTX 2080 ti is finishing these WUs in about 6100 seconds, which is about the same time as computers running linux with same card.I came to this conclusion too. The runtimes on Windows 10 are about 10880 sec (3h 1m 20s) (11200 sec on my other host), while on Linux it's about 10280 sec (2h 51m 20s) on GTX 1080 Ti (Linux is about 5.5% faster). These are different cards, and the fastest GPU appears to be the slowest in this list. It's possible that the CPU feeding the GPU(s) is more important for the ACEMD3 than it was for the ACEMD2, as my ACEMD3-wise slowest host has the oldest CPU (i7-4930k, which is 3rd gen.: Ivy Bridge E) while the other has an i3-4330 (which is 4rd gen.: Haswell). The other difference between the two Windows host is that the i7 had 2 rosetta@home tasks running, while the i3 had only the ACEMD3 running. Now I reduced the number of rosetta@home tasks to 1. I will suspend rosetta@home if there will be a steady flow of GPUGrid workunits. | |
| ID: 53071 | Rating: 0 | rate:
| |
|
Retvari Zoltan Send message Joined: 20 Jan 09 Posts: 2343 Credit: 16,201,255,749 RAC: 0 Level Scientific publications | |
While this high readout of GPU usage could be misleading, I think it's true this time. I expected this to happen on Windows 10 v1703, but apparently it didn't. So it seems that older CUDA versions (8.0) don't have their appropriate drivers to get around WDDM, but CUDA 10 has it.Is the WDDM lag gone or is it my imagination?Given that the various tool now show a GPU utilization of mostly up to 99% or even 100% (as it was with WinXP before), it would seem to me that the WDDM does not play a role any more. I mentioned it at the end of a post almost 2 years ago. There are new abbreviations from Microsoft to memorize (the links lead to TLDR pages, so click on them at your own risk): DCH: Declarative Componentized Hardware supported apps UWP: Universal Windows Platform WDF: Windows Driver Frameworks - KMDF: Kernel-Mode Driver Framework - UMDF: User-Mode Driver Framework This 'new' Windows Driver Framework is responsible for the 'lack of WDDM' and its overhead. Good work! | |
| ID: 53072 | Rating: 0 | rate:
| |
|
[AF>Libristes]on2vhf Send message Joined: 7 Oct 17 Posts: 2 Credit: 7,615,020 RAC: 0 Level Scientific publications | |
|
Hi, | |
| ID: 53073 | Rating: 0 | rate:
| |
|
Toni Volunteer moderator Project administrator Project developer Project tester Project scientist Send message Joined: 9 Dec 08 Posts: 1006 Credit: 5,068,599 RAC: 0 Level Scientific publications | |
|
100% GPU use and low WDDM overhead are nice news. However, they may be a specific to this particular WU type - we'll see in the future. (The swan sync variable is ignored and plays no role.) | |
| ID: 53075 | Rating: 0 | rate:
| |
|
[AF>Libristes] hermes Send message Joined: 11 Nov 16 Posts: 26 Credit: 710,087,297 RAC: 0 Level Scientific publications | |
|
For me, 100% on GPU is not the best ;-) | |
| ID: 53084 | Rating: 0 | rate:
| |
|
Erich56 Send message Joined: 1 Jan 15 Posts: 1105 Credit: 7,822,620,176 RAC: 1,815,365 Level Scientific publications | |
|
there was a task which ended after 41 seconds with: | |
| ID: 53085 | Rating: 0 | rate:
| |
|
mmonnin Send message Joined: 2 Jul 16 Posts: 333 Credit: 4,994,301,065 RAC: 18,840,017 Level Scientific publications | |
|
Are tasks being sent out for CUDA80 plan_class? I have only received new tasks on my 1080Ti with driver 418 and none on another system with 10/1070Ti with driver 396, which doesn't support CUDA100 | |
| ID: 53087 | Rating: 0 | rate:
| |
|
rod4x4 Send message Joined: 4 Aug 14 Posts: 266 Credit: 2,219,935,054 RAC: 0 Level Scientific publications | |
there was a task which ended after 41 seconds with: unfortunately ACEMD3 no longer tells you the real error. The wrapper provides a meaningless generic message. (error 195) The task error in your STDerr Output is # Engine failed: Particle coordinate is nan I had this twice on one host. Not sure if I am completely correct as ACEMD3 is a new beast we have to learn and tame, but in my case I reduced the Overclocking and it seemed to fix the issue, though that could just be a coincidence. | |
| ID: 53088 | Rating: 0 | rate:
| |
|
ALAIN_13013  Send message Joined: 11 Sep 08 Posts: 18 Credit: 1,547,879,462 RAC: 0 Level Scientific publications | |
For me, 100% on GPU is not the best ;-) C'est exactement ce que j'ai fait en installant une GT710 juste pour la sortie vidéo, c'est au top, du coup ma 980 Ti à 100% de charge ne me dérange pas du tout ! ____________  | |
| ID: 53089 | Rating: 0 | rate:
| |
|
rod4x4 Send message Joined: 4 Aug 14 Posts: 266 Credit: 2,219,935,054 RAC: 0 Level Scientific publications | |
Are tasks being sent out for CUDA80 plan_class? I have only received new tasks on my 1080Ti with driver 418 and none on another system with 10/1070Ti with driver 396, which doesn't support CUDA100 Yes CUDA80 is supported, see apps page here:https://www.gpugrid.net/apps.php Also see FAQ for ACEMD3 here: https://www.gpugrid.net/forum_thread.php?id=5002 | |
| ID: 53090 | Rating: 0 | rate:
| |
|
Bedrich Hajek Send message Joined: 28 Mar 09 Posts: 477 Credit: 9,338,822,716 RAC: 10,910,487 Level Scientific publications | |
there was a task which ended after 41 seconds with: I had a couple errors on my windows 7 computer, and none on my windows 10 computer, so far. In my case, it's not overclocking, since I don't overclock. http://www.gpugrid.net/results.php?hostid=494023&offset=0&show_names=0&state=0&appid=32 Yes, I do believe we need some more testing. | |
| ID: 53092 | Rating: 0 | rate:
| |
|
mmonnin Send message Joined: 2 Jul 16 Posts: 333 Credit: 4,994,301,065 RAC: 18,840,017 Level Scientific publications | |
Are tasks being sent out for CUDA80 plan_class? I have only received new tasks on my 1080Ti with driver 418 and none on another system with 10/1070Ti with driver 396, which doesn't support CUDA100 Then the app requires an odd situation in Linux where it supposedly supports CUDA 80 but to use it requires a newer driver beyond it. What driver/card/OS combinations are supported? Windows, CUDA80 Minimum Driver r367.48 or higher Linux, CUDA92 Minimum Driver r396.26 or higher Linux, CUDA100 Minimum Driver r410.48 or higher Windows, CUDA101 Minimum Driver r418.39 or higher There's not even a Linux CUDA92 plan_class so I'm not sure what thats for in the FAQ. | |
| ID: 53093 | Rating: 0 | rate:
| |
|
klepel Send message Joined: 23 Dec 09 Posts: 189 Credit: 4,407,156,793 RAC: 2,298,185 Level Scientific publications | |
|
I just wanted to confirm, you need a driver supporting CUDA100 or CUDA101, then even a GTX670 can crunch the "acemd3" app. | |
| ID: 53096 | Rating: 0 | rate:
| |
|
mmonnin Send message Joined: 2 Jul 16 Posts: 333 Credit: 4,994,301,065 RAC: 18,840,017 Level Scientific publications | |
Are tasks being sent out for CUDA80 plan_class? I have only received new tasks on my 1080Ti with driver 418 and none on another system with 10/1070Ti with driver 396, which doesn't support CUDA100 And now I got the 1st CUDA80 task on that system w/o any driver changes. | |
| ID: 53098 | Rating: 0 | rate:
| |
|
rod4x4 Send message Joined: 4 Aug 14 Posts: 266 Credit: 2,219,935,054 RAC: 0 Level Scientific publications | |
there was a task which ended after 41 seconds with: Checking this task, it has failed on 8 computers so it is just a faulty work unit. clocking would not be the cause as previously stated. | |
| ID: 53100 | Rating: 0 | rate:
| |
|
rod4x4 Send message Joined: 4 Aug 14 Posts: 266 Credit: 2,219,935,054 RAC: 0 Level Scientific publications | |
there was a task which ended after 41 seconds with: Agreed, testing will be an ongoing process...some errors cannot be fixed. this task had an error code 194... finish file present too long</message> This error has been seen in ACEMD2 and listed as "Unknown" Matt Harvey did a FAQ on error codes for ACEMD2 here http://gpugrid.net/forum_thread.php?id=3468 | |
| ID: 53101 | Rating: 0 | rate:
| |
|
Finally Cuda 10.1! Supprot for Turing Cuda Cores other words. | |
| ID: 53102 | Rating: 0 | rate:
| |
|
Keith Myers Send message Joined: 13 Dec 17 Posts: 1313 Credit: 6,018,992,459 RAC: 10,024,692 Level Scientific publications | |
this task had an error code 194... This is a bug in the BOINC 7.14.2 client and earlier versions. You need to update to the 7.16 branch to fix it. Identified/quantified in https://github.com/BOINC/boinc/issues/3017 And resolved for the client in: https://github.com/BOINC/boinc/pull/3019 And in the server code in: https://github.com/BOINC/boinc/pull/3300 | |
| ID: 53103 | Rating: 0 | rate:
| |
|
rod4x4 Send message Joined: 4 Aug 14 Posts: 266 Credit: 2,219,935,054 RAC: 0 Level Scientific publications | |
this task had an error code 194... Thanks for the info and links. Sometimes we overlook the Boinc Client performance. From the Berkeley download page(https://boinc.berkeley.edu/download_all.php): 7.16.3 Development version (MAY BE UNSTABLE - USE ONLY FOR TESTING) and 7.14.2 Recommended version This needs to be considered by volunteers, install latest version if you are feeling adventurous. (any issues you may find will help the Berkeley team develop the new client) Alternatively, - reducing the CPU load on your PC and/or - ensuring the PC is not rebooted as the finish file is written, may avert this error. | |
| ID: 53104 | Rating: 0 | rate:
| |
|
Keith Myers Send message Joined: 13 Dec 17 Posts: 1313 Credit: 6,018,992,459 RAC: 10,024,692 Level Scientific publications | |
|
I haven't had a single instance of "finish file present" errors since moving to the 7.16 branch. I used to get a couple or more a day before on 7.14.2 or earlier. | |
| ID: 53105 | Rating: 0 | rate:
| |
|
Greg _BE Send message Joined: 30 Jun 14 Posts: 127 Credit: 110,756,939 RAC: 4,306 Level Scientific publications | |
For me, 100% on GPU is not the best ;-) I see you have a RTX and a GTX. You could save your GTX for video and general PC usage and put the RTX full time on GPU tasks. I find this odd that you are having issues seeing videos. I noticed that with my system as well and it was not the GPU that was having trouble, it was the CPU that was overloaded. After I changed the CPU time to like 95% then I had no trouble watching videos. After much tweaking on the way BOINC and all the projects I run use my system, I finally have it to where I can watch videos without any problems and I use a GTX 1050TI as my primary card along with a Ryzen 2700 with no video processor. There must be something overloading your system if you can't watch videos on a RTX GPU while running GPU Grid. | |
| ID: 53109 | Rating: 0 | rate:
| |
|
wiyosaya Send message Joined: 22 Nov 09 Posts: 114 Credit: 589,114,683 RAC: 0 Level Scientific publications | |
|
I am getting high CPU/South bridge temps on one of my PCs with these latest work units. | |
| ID: 53110 | Rating: 0 | rate:
| |
|
Retvari Zoltan Send message Joined: 20 Jan 09 Posts: 2343 Credit: 16,201,255,749 RAC: 0 Level Scientific publications | |
I am getting high CPU/South bridge temps on one of my PCs with these latest work units.That's because of two reasons: 1. The new app uses a whole CPU thread (or core, if there's no HT or SMT) to feed the GPU 2. The new app is not hindered by WDDM. Every WU since November 22, 2019 had been exhibiting high temperatures on this PC. The previous apps never exhibited this.That's because of two reasons: 1. The old app didn't feed the GPU with a full CPU thread unless the user configured it with the SWAN_SYNC environmental variable. 2. The performance of the old app was hindered by WDDM (under Windows Vista...10) In addition, I found the PC unresponsive this afternoon. I was able to reboot, however, this does not give me a warm fuzzy feeling about continuing to run GPUGrid on this PC.There are a few options: 1. reduce the GPU's clock frequency (and the GPU voltage accordingly) or its power target. 2. increase cooling (cleaning fins, increasing air ventilation/fan speed). If the card is overclocked (by you, or the factory) you should re-calibrate the overclock settings for the new app. A small reduction in GPU voltage and frequency results in perceptible decrease of the power consumption (=heat output), as the power consumption is in direct ratio of the clock frequency multiplied by the GPU voltage squared. | |
| ID: 53111 | Rating: 0 | rate:
| |
|
RFGuy_KCCO Send message Joined: 13 Feb 14 Posts: 6 Credit: 1,056,951,005 RAC: 147 Level Scientific publications | |
|
I have found that running GPU's at 60-70% of their stock power level is the sweet spot in the compromise between PPD and power consumption/temps. I usually run all of my GPU's at 60% power level. | |
| ID: 53114 | Rating: 0 | rate:
| |
Finally Cuda 10.1! Supprot for Turing Cuda Cores other words. 13134.75 seconds run-time @ RTX 2060, Ryzen 2600,Windows 10 1909. Average GPU CUDA utilisation 99%. No Issue at all with those workunit. | |
| ID: 53119 | Rating: 0 | rate:
| |
|
KAMasud Send message Joined: 27 Jul 11 Posts: 137 Credit: 523,901,354 RAC: 0 Level Scientific publications | |
[quote]1. The old app didn't feed the GPU with a full CPU thread unless the user configured it with the SWAN_SYNC environmental variable. Something was making my Climate models unstable and crashing them. That was the reason I lassoed in the GPU through SWAN_SYNC. Now my Climate models are stable. Plus I am getting better clock speeds. | |
| ID: 53126 | Rating: 0 | rate:
| |
|
ServicEnginIC Send message Joined: 24 Sep 10 Posts: 572 Credit: 7,516,447,024 RAC: 10,464,686 Level Scientific publications | |
I am getting high CPU/South bridge temps on one of my PCs with these latest work units. As commented in several threads along GPUGrid forum, new ACEMD3 tasks are challenging our computers to their maximum. They can be taken as a true hardware Quality Control! Either CPUs, GPUs, PSUs and MoBos seem to be squeezed simultaneously while processing theese tasks. I'm thinking of printing stickers for my computers: "I processed ACEMD3 and survived" ;-) Regarding your processor: Intel(R) Xeon(R) CPU E5-1650 v2 @ 3.50GHz It has a rated TDP of 130W. A lot of heat to dissipate... It was launched on Q3/2013. If it has been running for more than three years, I would recommend to renew CPU cooler's thermal paste. A clean CPU cooler and a fresh thermal paste usually help to reduce CPU temperature by several degrees. Regarding chipset temperature: I can't remember any motherboard that I can touch chipset heatsinks with confidence. Chipset heat evacuation is based in most of standard motherboards on passive air convection heatsinks. If there is room at the upper back of your computer case, I would recommend to install an extra fan to extract heated air and improve air circulation. | |
| ID: 53129 | Rating: 0 | rate:
| |
|
Jim1348 Send message Joined: 28 Jul 12 Posts: 819 Credit: 1,591,285,971 RAC: 0 Level Scientific publications | |
|
Wow. My GTX 980 on Ubuntu 18.04.3 is running at 80C. It is a three-fan version, not overclocked, with a large heatsink. I don't recall seeing it above 65C before. | |
| ID: 53132 | Rating: 0 | rate:
| |
|
Keith Myers Send message Joined: 13 Dec 17 Posts: 1313 Credit: 6,018,992,459 RAC: 10,024,692 Level Scientific publications | |
|
Tdie is the cpu temp of the 3700X. Tctl is the package power limit offset temp. The offset is 0 on Ryzen 3000. The offset is 20° C. on Ryzen 1000 and 10° C. on Ryzen 2000. The offset is used for cpu fan control. | |
| ID: 53133 | Rating: 0 | rate:
| |
|
Jim1348 Send message Joined: 28 Jul 12 Posts: 819 Credit: 1,591,285,971 RAC: 0 Level Scientific publications | |
|
Thanks. It is an ASRock board, and it probably has the same capability. I will look around. | |
| ID: 53136 | Rating: 0 | rate:
| |
|
Keith Myers Send message Joined: 13 Dec 17 Posts: 1313 Credit: 6,018,992,459 RAC: 10,024,692 Level Scientific publications | |
|
AFAIK, only ASUS implemented an WMI BIOS to overcome the limitations and restrictions of using a crappy SIO chip on most of their boards. keith@Serenity:~$ sensors $asus-isa-0000 Adapter: ISA adapter cpu_fan: 0 RPM asuswmisensors-isa-0000 Adapter: ISA adapter CPU Core Voltage: +1.24 V CPU SOC Voltage: +1.07 V DRAM Voltage: +1.42 V VDDP Voltage: +0.64 V 1.8V PLL Voltage: +2.14 V +12V Voltage: +11.83 V +5V Voltage: +4.80 V 3VSB Voltage: +3.36 V VBAT Voltage: +3.27 V AVCC3 Voltage: +3.36 V SB 1.05V Voltage: +1.11 V CPU Core Voltage: +1.26 V CPU SOC Voltage: +1.09 V DRAM Voltage: +1.46 V CPU Fan: 1985 RPM Chassis Fan 1: 0 RPM Chassis Fan 2: 0 RPM Chassis Fan 3: 0 RPM HAMP Fan: 0 RPM Water Pump: 0 RPM CPU OPT: 0 RPM Water Flow: 648 RPM AIO Pump: 0 RPM CPU Temperature: +72.0°C CPU Socket Temperature: +45.0°C Motherboard Temperature: +36.0°C Chipset Temperature: +52.0°C Tsensor 1 Temperature: +216.0°C CPU VRM Temperature: +50.0°C Water In: +216.0°C Water Out: +35.0°C CPU VRM Output Current: +71.00 A k10temp-pci-00c3 Adapter: PCI adapter Tdie: +72.2°C (high = +70.0°C) Tctl: +72.2°C keith@Serenity:~ | |
| ID: 53139 | Rating: 0 | rate:
| |
|
Keith Myers Send message Joined: 13 Dec 17 Posts: 1313 Credit: 6,018,992,459 RAC: 10,024,692 Level Scientific publications | |
|
So you can at least look at the driver project at github, this is the link. | |
| ID: 53141 | Rating: 0 | rate:
| |
|
Jim1348 Send message Joined: 28 Jul 12 Posts: 819 Credit: 1,591,285,971 RAC: 0 Level Scientific publications | |
|
OK, I will look at it occasionally. I think Psensor is probably good enough. Fortunately, the case has room for two (or even three) 120 mm fans side by side, so I can cool the length of the card better, I just don't normally have to. | |
| ID: 53146 | Rating: 0 | rate:
| |
|
Greg _BE Send message Joined: 30 Jun 14 Posts: 127 Credit: 110,756,939 RAC: 4,306 Level Scientific publications | |
|
I am running at GTX 1050 at full load and full OC and it goes to only 56C. Fan speed is about 90% of capacity. | |
| ID: 53147 | Rating: 0 | rate:
| |
|
computezrmle Send message Joined: 10 Jun 13 Posts: 9 Credit: 295,692,471 RAC: 0 Level Scientific publications | |
|
@ Keith Myers Water In: +216.0°C @ Greg _BE my system with a Ryzen7 2700 running at 40.75 GHZ ... rarely gets above 81C. Wow!! @ Jim1348 This is the output from standard sensors package. >sensors nct6779-isa-0290
nct6779-isa-0290
Adapter: ISA adapter
Vcore: +0.57 V (min = +0.00 V, max = +1.74 V)
in1: +1.09 V (min = +0.00 V, max = +0.00 V) ALARM
AVCC: +3.23 V (min = +2.98 V, max = +3.63 V)
+3.3V: +3.23 V (min = +2.98 V, max = +3.63 V)
in4: +1.79 V (min = +0.00 V, max = +0.00 V) ALARM
in5: +0.92 V (min = +0.00 V, max = +0.00 V) ALARM
in6: +1.35 V (min = +0.00 V, max = +0.00 V) ALARM
3VSB: +3.46 V (min = +2.98 V, max = +3.63 V)
Vbat: +3.28 V (min = +2.70 V, max = +3.63 V)
in9: +0.00 V (min = +0.00 V, max = +0.00 V)
in10: +0.75 V (min = +0.00 V, max = +0.00 V) ALARM
in11: +0.78 V (min = +0.00 V, max = +0.00 V) ALARM
in12: +1.66 V (min = +0.00 V, max = +0.00 V) ALARM
in13: +0.91 V (min = +0.00 V, max = +0.00 V) ALARM
in14: +0.74 V (min = +0.00 V, max = +0.00 V) ALARM
fan1: 3479 RPM (min = 0 RPM)
fan2: 0 RPM (min = 0 RPM)
fan3: 0 RPM (min = 0 RPM)
fan4: 0 RPM (min = 0 RPM)
fan5: 0 RPM (min = 0 RPM)
SYSTIN: +40.0°C (high = +0.0°C, hyst = +0.0°C) sensor = thermistor
CPUTIN: +48.5°C (high = +80.0°C, hyst = +75.0°C) sensor = thermistor
AUXTIN0: +8.0°C sensor = thermistor
AUXTIN1: +40.0°C sensor = thermistor
AUXTIN2: +38.0°C sensor = thermistor
AUXTIN3: +40.0°C sensor = thermistor
SMBUSMASTER 0: +57.5°C
PCH_CHIP_CPU_MAX_TEMP: +0.0°C
PCH_CHIP_TEMP: +0.0°C
PCH_CPU_TEMP: +0.0°C
intrusion0: ALARM
intrusion1: ALARM
beep_enable: disabled The real Tdie is shown as "SMBUSMASTER 0" already reduced by 27° (Threadripper offset) using the following formula in /etc/sensors.d/x399.conf chip "nct6779-isa-0290"
compute temp7 @-27, @+27 | |
| ID: 53148 | Rating: 0 | rate:
| |
|
Greg _BE Send message Joined: 30 Jun 14 Posts: 127 Credit: 110,756,939 RAC: 4,306 Level Scientific publications | |
|
No..its just 177F. No idea where you got that value from. @ Keith Myers | |
| ID: 53149 | Rating: 0 | rate:
| |
|
rod4x4 Send message Joined: 4 Aug 14 Posts: 266 Credit: 2,219,935,054 RAC: 0 Level Scientific publications | |
@ Keith Myers I saw the same thing. Funny Huh! | |
| ID: 53150 | Rating: 0 | rate:
| |
|
Jim1348 Send message Joined: 28 Jul 12 Posts: 819 Credit: 1,591,285,971 RAC: 0 Level Scientific publications | |
|
The heatsink on the Ryzen 3600 that reports Tdie and Tctl at 95C is only moderately warm to the touch. That was the case when I installed it. | |
| ID: 53151 | Rating: 0 | rate:
| |
|
Greg _BE Send message Joined: 30 Jun 14 Posts: 127 Credit: 110,756,939 RAC: 4,306 Level Scientific publications | |
|
https://i.pinimg.com/originals/94/63/2d/94632de14e0b1612e4c70111396dc03f.jpg | |
| ID: 53152 | Rating: 0 | rate:
| |
|
Greg _BE Send message Joined: 30 Jun 14 Posts: 127 Credit: 110,756,939 RAC: 4,306 Level Scientific publications | |
|
I have checked my system with HW Monitor,CAM,MSI Command Center and Ryzen Master. All report the same thing. 80C and AMD says max 95C before shutdown. | |
| ID: 53153 | Rating: 0 | rate:
| |
|
computezrmle Send message Joined: 10 Jun 13 Posts: 9 Credit: 295,692,471 RAC: 0 Level Scientific publications | |
No idea where you got that value from. I got it from this message: http://www.gpugrid.net/forum_thread.php?id=5015&nowrap=true#53139 If this is really °C then 216 would be steam or if it is °F then 35 would be close to ice. Water In: +216.0°C If the chip is 80C, then I guess the outgoing water would be that, but the radiator does not feel that hot. Seriously (don't try this!) -> any temp >60 °C would burn your fingers. Most components used in watercooling circuits are specified for a Tmax (water!) of 65 °C. Any cooling medium must be (much) cooler than the device to establish a heat flow. But are you sure you really run your Ryzen at 40.75 GHZ? It's from this post: http://www.gpugrid.net/forum_thread.php?id=5015&nowrap=true#53147 ;-) | |
| ID: 53154 | Rating: 0 | rate:
| |
|
Aurum Send message Joined: 12 Jul 17 Posts: 400 Credit: 13,832,764,882 RAC: 30,787,057 Level Scientific publications | |
This would be steam!Not at 312 PSIA. ____________ | |
| ID: 53156 | Rating: 0 | rate:
| |
|
Keith Myers Send message Joined: 13 Dec 17 Posts: 1313 Credit: 6,018,992,459 RAC: 10,024,692 Level Scientific publications | |
@ Keith Myers No, it is just the value you get from an unterminated input on the ASUS boards. Put a standard 10K thermistor on it and it reads normally. Just ignore any input with the +216.0 °C value. If you are so annoyed,you could fabricate two-pin headers with a resistor to pull the inputs down. | |
| ID: 53159 | Rating: 0 | rate:
| |
|
klepel Send message Joined: 23 Dec 09 Posts: 189 Credit: 4,407,156,793 RAC: 2,298,185 Level Scientific publications | |
|
I just made an interesting observation comparing my computers with GTX1650 and GTX1660ti with ServicEnginIC´s computers: | |
| ID: 53163 | Rating: 0 | rate:
| |
|
biodoc Send message Joined: 26 Aug 08 Posts: 183 Credit: 7,476,964,375 RAC: 50,105,118 Level Scientific publications | |
The heatsink on the Ryzen 3600 that reports Tdie and Tctl at 95C is only moderately warm to the touch. That was the case when I installed it. One option to cool your processor down a bit is to run it at base frequency using the cTDP and PPL (package power limit) settings in the bios. Both are set at auto in the "optimized defaults" bios setting. AMD and the motherboard manufacturers assume we are gamers or enthusiasts that want to automatically overclock the processors to the thermal limit. Buried somewhere in the bios AMD CBS folder there should be an option to set the cTDP and PPL to manual mode. When set to manual you can key in values for watts. I have my 3700X rigs set to 65 and 65 watts for cTDP and PPL. My 3900X is set to 105 and 105 watts respectively. The numbers come from the TDP of the processor. So for a 3600 it would be 65 and for a 3600X the number is 95 watts. Save the bios settings and the processor will now run at base clock speed at full load and will draw quite a bit less power at the wall. Here's some data I collected on my 3900X. 3900X (105 TDP; AGESA 1.0.0.3 ABBA) data running WCG at full load: bios optimized defaults (PPL at 142?): 4.0 GHz pulls 267 watts at the wall. TDP/PPL (package power limit) set at 105/105: 3.8 GHz pulls 218 watts at the wall TDP/PPL set at 65/88: 3.7 GHz pulls 199 watts at the wall TDP/PPL set at 65/65: 3.0 GHz pulls 167 watts at the wall 3.8 to 4 GHz requires 52 watts 3.7 to 4 GHz requires 68 watts 3.7 -3.8 GHz requires 20 watts 3.0 -3.7 GHz requires 32 watts Note: The latest bios with 1.0.0.4 B does not allow me to underclock using TDP/PPL bios settings. | |
| ID: 53167 | Rating: 0 | rate:
| |
|
Retvari Zoltan Send message Joined: 20 Jan 09 Posts: 2343 Credit: 16,201,255,749 RAC: 0 Level Scientific publications | |
Might it be that the Wrapper is slower on slower CPUs and therefore slows down the GPUs?I have similar experiences with my hosts. | |
| ID: 53168 | Rating: 0 | rate:
| |
|
Pop Piasa Send message Joined: 8 Aug 19 Posts: 252 Credit: 458,054,251 RAC: 0 Level Scientific publications | |
|
Thank you Rod4x4, I later saw the first WU speed up and subsequent units have been running over 12%/Hr without issues. Guess I jumped on that too fast. The 1% increments are OK with me. Thanks again. | |
| ID: 53170 | Rating: 0 | rate:
| |
|
Jim1348 Send message Joined: 28 Jul 12 Posts: 819 Credit: 1,591,285,971 RAC: 0 Level Scientific publications | |
The heatsink on the Ryzen 3600 that reports Tdie and Tctl at 95C is only moderately warm to the touch. That was the case when I installed it. Thanks, but I believe you misread me. The CPU is fine. The measurement is wrong. | |
| ID: 53171 | Rating: 0 | rate:
| |
|
ServicEnginIC Send message Joined: 24 Sep 10 Posts: 572 Credit: 7,516,447,024 RAC: 10,464,686 Level Scientific publications | |
The computers of ServicEnginIC are approx. 10% slower than mine. His CPUs are Intel(R) Core(TM)2 Quad CPU Q9550 @ 2.83GHz and Intel(R) Core(TM)2 Quad CPU Q9550 @ 2.83GHz, mine are two AMD Ryzen 5 2600 Six-Core Processors. I have similar experiences with my hosts. +1 And some other cons for my veteran rigs: - DDR3 @1.333 MHZ DRAM - Both Motherboards are PCIE 2.0, probably bottlenecking PCIE 3.0 for newest cards 10% performance loss seems to be congruent with all of this | |
| ID: 53172 | Rating: 0 | rate:
| |
|
Keith Myers Send message Joined: 13 Dec 17 Posts: 1313 Credit: 6,018,992,459 RAC: 10,024,692 Level Scientific publications | |
Thanks, but I believe you misread me. The CPU is fine. The measurement is wrong. No, I believe the measurement is incorrect but is still going to be rather high in actuality. The Ryzen 3600 ships with the Wraith Stealth cooler which is just the normal Intel solution of a copper plug embedded into a aluminum casting. It just doesn't have the ability to quickly move heat away from the IHS. You would see much better temps if you switched to the Wraith MAX or Wraith Prism cooler which have real heat pipes and normal sized fans. The temps are correct for the Ryzen and Ryzen+ cpus, but the k10temp driver which is stock in Ubuntu didn't get the change needed to accommodate the Ryzen 2 cpus with the correct 0 temp offset. That only is shipping in the 5.3.4 or 5.4 kernels. https://www.phoronix.com/scan.php?page=news_item&px=AMD-Zen2-k10temp-Patches There are other solutions you could use in the meantime like the ASUS temp driver if you have a compatible motherboard or there also is a zenpower driver that can report the proper temp as well as the cpu power. https://github.com/ocerman/zenpower | |
| ID: 53175 | Rating: 0 | rate:
| |
|
Greg _BE Send message Joined: 30 Jun 14 Posts: 127 Credit: 110,756,939 RAC: 4,306 Level Scientific publications | |
|
Damn! Wishful thinking! | |
| ID: 53176 | Rating: 0 | rate:
| |
|
Greg _BE Send message Joined: 30 Jun 14 Posts: 127 Credit: 110,756,939 RAC: 4,306 Level Scientific publications | |
|
Tony - I keep getting this on random tasks | |
| ID: 53177 | Rating: 0 | rate:
| |
|
Jim1348 Send message Joined: 28 Jul 12 Posts: 819 Credit: 1,591,285,971 RAC: 0 Level Scientific publications | |
The temps are correct for the Ryzen and Ryzen+ cpus, but the k10temp driver which is stock in Ubuntu didn't get the change needed to accommodate the Ryzen 2 cpus with the correct 0 temp offset. That only is shipping in the 5.3.4 or 5.4 kernels. Then it is probably reading 20C too high, and the CPU is really at 75C. Yes, I can improve on that. Thanks. | |
| ID: 53178 | Rating: 0 | rate:
| |
|
rod4x4 Send message Joined: 4 Aug 14 Posts: 266 Credit: 2,219,935,054 RAC: 0 Level Scientific publications | |
Tony - I keep getting this on random tasks # Engine failed: Particle coordinate is nan Two issues can cause this error: 1. Error in the Task. This would mean all Hosts fail the task. See this link for details: https://github.com/openmm/openmm/issues/2308 2. If other Hosts do not fail the task, the error could be in the GPU Clock rate. I have tested this on one of my hosts and am able to produce this error when I Clock the GPU too high. It also appears that BOINC or the task is ignoring the appconfig command to use only my 1050. One setting to try....In Boinc Manager, Computer Preferences, set the "Switch between tasks every xxx minutes" to between 800 - 9999. This should allow the task to finish on the same GPU it started on. Can you post your app_config.xml file contents? | |
| ID: 53179 | Rating: 0 | rate:
| |
|
Keith Myers Send message Joined: 13 Dec 17 Posts: 1313 Credit: 6,018,992,459 RAC: 10,024,692 Level Scientific publications | |
|
I've had a couple of the NaN errors. One where everyone errors out the task and another recently where it errored out after running through to completion. I had already removed all overclocking on the card but it still must have been too hot for the stock clockrate. It is my hottest card being sandwiched in the middle of the gpu stack with very little airflow. I am going to have to start putting in negative clock offset on it to get the temps down I think to avoid any further NaN errors on that card. | |
| ID: 53180 | Rating: 0 | rate:
| |
|
rod4x4 Send message Joined: 4 Aug 14 Posts: 266 Credit: 2,219,935,054 RAC: 0 Level Scientific publications | |
I've had a couple of the NaN errors. One where everyone errors out the task and another recently where it errored out after running through to completion. I had already removed all overclocking on the card but it still must have been too hot for the stock clockrate. It is my hottest card being sandwiched in the middle of the gpu stack with very little airflow. I am going to have to start putting in negative clock offset on it to get the temps down I think to avoid any further NaN errors on that card. Would be interested to hear if the Under Clocking / Heat reduction fixes the issue. I am fairly confident this is the issue, but need validation / more data from fellow volunteers to be sure. | |
| ID: 53181 | Rating: 0 | rate:
| |
|
Erich56 Send message Joined: 1 Jan 15 Posts: 1105 Credit: 7,822,620,176 RAC: 1,815,365 Level Scientific publications | |
http://www.gpugrid.net/show_host_detail.php?hostid=147723 that's really interesting: the comparison of above two tasks shows that the host with the GTX1660ti yields lower GFLOP figures (single as well as double) as the host with the GTX1650. In both hosts, the CPU ist the same: Intel(R) Core(TM)2 Quad CPU Q9550 @ 2.83GHz. And now the even more surprising fact: by coincidence, exactly the same CPU is running in one of my hosts (http://www.gpugrid.net/show_host_detail.php?hostid=205584) with a GTX750ti - and here the GFLOP figures are even markedly higher than in the abeove cited hosts with more modern GPUs. So, is the conclusion now: the weaker the GPU, the higher the number of GFLOPs generated by the system? | |
| ID: 53183 | Rating: 0 | rate:
| |
|
Retvari Zoltan Send message Joined: 20 Jan 09 Posts: 2343 Credit: 16,201,255,749 RAC: 0 Level Scientific publications | |
The "Integer" (I hope it's called this way in English) speed measured is way much higher under Linux than under Windows.http://www.gpugrid.net/show_host_detail.php?hostid=147723that's really interesting: the comparison of above two tasks shows that the host with the GTX1660ti yields lower GFLOP figures (single as well as double) as the host with the GTX1650. (the 1st and 2nd host use Linux, the 3rd use Windows) See the stats of my dual boot host: Linux 139876.18 - Windows 12615.42 There's more than one order of magnitude difference between the two OS on the same hardware, one of them must be wrong. | |
| ID: 53184 | Rating: 0 | rate:
| |
|
Greg _BE Send message Joined: 30 Jun 14 Posts: 127 Credit: 110,756,939 RAC: 4,306 Level Scientific publications | |
Damn! Wishful thinking! ------------------------ Hi Greg I talked to my colleague who is in the Liquid Freezer II Dev. Team and he said that theese temps are normal with this kind of load. Installation sounds good to me. With kind regards Your ARCTIC Team, Stephan Arctic/Service Manager | |
| ID: 53185 | Rating: 0 | rate:
| |
|
Greg _BE Send message Joined: 30 Jun 14 Posts: 127 Credit: 110,756,939 RAC: 4,306 Level Scientific publications | |
Tony - I keep getting this on random tasks -------------------- <?xml version="1.0"?> -<app_config> -<exclude_gpu> <url>www.gpugrid.net</url> <device_num>1</device_num> <type>NVIDIA</type> </exclude_gpu> </app_config> I was having some issues with LHC ATLAS and was in the process of putting the tasks on pause and then disconnecting the client. In this process I discovered that another instance popped up right after I closed the one I was looking at and then I got another instance popping up with a message saying that there were two running. I shut that down and it shut down the last instance. This is a first for me. I have restarted my computer and now will wait and see whats going on. | |
| ID: 53186 | Rating: 0 | rate:
| |
|
computezrmle Send message Joined: 10 Jun 13 Posts: 9 Credit: 295,692,471 RAC: 0 Level Scientific publications | |
|
What you posted is a mix of app_config.xml and cc_config.xml. | |
| ID: 53187 | Rating: 0 | rate:
| |
|
Greg _BE Send message Joined: 30 Jun 14 Posts: 127 Credit: 110,756,939 RAC: 4,306 Level Scientific publications | |
What you posted is a mix of app_config.xml and cc_config.xml. You give me a page on CC config. I jumped down to what appears to be stuff related to app_config and copied this <exclude_gpu> <url>project_URL</url> [<device_num>N</device_num>] [<type>NVIDIA|ATI|intel_gpu</type>] [<app>appname</app>] </exclude_gpu> project id is the gpugrid.net device = 1 type is nvidia removed app name since app name changes so much *****GPUGRID: Notice from BOINC Missing <app_config> in app_config.xml 11/28/2019 8:24:51 PM*** This is why I had it in the text. | |
| ID: 53189 | Rating: 0 | rate:
| |
|
Greg _BE Send message Joined: 30 Jun 14 Posts: 127 Credit: 110,756,939 RAC: 4,306 Level Scientific publications | |
|
What the heck now???!!! | |
| ID: 53190 | Rating: 0 | rate:
| |
|
Zalster Send message Joined: 26 Feb 14 Posts: 211 Credit: 4,496,324,562 RAC: 0 Level Scientific publications | |
<cc_config> <exclude_gpu> <url>project_URL</url> [<device_num>N</device_num>] [<type>NVIDIA|ATI|intel_gpu</type>] [<app>appname</app>] </exclude_gpu </cc_config> This needs to go into the Boinc folder not the GPUGrid project folder ____________   | |
| ID: 53191 | Rating: 0 | rate:
| |
|
Keith Myers Send message Joined: 13 Dec 17 Posts: 1313 Credit: 6,018,992,459 RAC: 10,024,692 Level Scientific publications | |
|
If you are going to use an exclude, then you need to exclude all dissimilar devices than the one you want to use. That is how to get rid of restart on different device errors. Or just set the switch between tasks to 360minutes or greater and don't exit BOINC while the task is running. | |
| ID: 53192 | Rating: 0 | rate:
| |
|
Toni Volunteer moderator Project administrator Project developer Project tester Project scientist Send message Joined: 9 Dec 08 Posts: 1006 Credit: 5,068,599 RAC: 0 Level Scientific publications | |
What the heck now???!!! I see two types of errors: ERROR: src\mdsim\context.cpp line 322: Cannot use a restart file on a different device! as the name says, exclusion not working. And # Engine failed: Particle coordinate is nan this usually indicates mathematical errors in the operations performed, memory corruption, or similar (or a faulty wu, unlikely in this case). Maybe a reboot will solve it. | |
| ID: 53193 | Rating: 0 | rate:
| |
|
computezrmle Send message Joined: 10 Jun 13 Posts: 9 Credit: 295,692,471 RAC: 0 Level Scientific publications | |
You give me a page on CC config. I posted the official documentation for more than just cc_config.xml: cc_config.xml nvc_config.xml app_config.xml It's worth to carefully read this page a couple of times as it provides all you need to know. Long ago the page had a direct link to the app_config.xml section. Unfortunately that link is not available any more but you may use your browser's find function. | |
| ID: 53194 | Rating: 0 | rate:
| |
|
Greg _BE Send message Joined: 30 Jun 14 Posts: 127 Credit: 110,756,939 RAC: 4,306 Level Scientific publications | |
If you are going to use an exclude, then you need to exclude all dissimilar devices than the one you want to use. That is how to get rid of restart on different device errors. Or just set the switch between tasks to 360minutes or greater and don't exit BOINC while the task is running. Ok, on point 1, it was set for 360 already because that's a good time for LHC ATLAS to run complete. I moved it up to 480 now to try and deal with this stuff in GPUGRID. Point 2 - Going to try a cc_config with a triple exclude gpu code block for here and for 2 other projects. From what I read this should be possible. | |
| ID: 53195 | Rating: 0 | rate:
| |
|
Greg _BE Send message Joined: 30 Jun 14 Posts: 127 Credit: 110,756,939 RAC: 4,306 Level Scientific publications | |
What the heck now???!!! One of these days I will get this problem solved. Driving me nuts! | |
| ID: 53196 | Rating: 0 | rate:
| |
|
rod4x4 Send message Joined: 4 Aug 14 Posts: 266 Credit: 2,219,935,054 RAC: 0 Level Scientific publications | |
Ok, on point 1, it was set for 360 already because that's a good time for LHC ATLAS to run complete. I moved it up to 480 now to try and deal with this stuff in GPUGRID. As your GPU is taking 728 minutes to complete the current batch of Tasks, this setting needs to be MORE that 728 to have a positive effect. Times for other projects don't suit GPUgrid requirements as tasks here can be longer. | |
| ID: 53197 | Rating: 0 | rate:
| |
|
Greg _BE Send message Joined: 30 Jun 14 Posts: 127 Credit: 110,756,939 RAC: 4,306 Level Scientific publications | |
Ok, on point 1, it was set for 360 already because that's a good time for LHC ATLAS to run complete. I moved it up to 480 now to try and deal with this stuff in GPUGRID. Oh? That's interesting. Changed to 750 minutes. | |
| ID: 53205 | Rating: 0 | rate:
| |
|
Greg _BE Send message Joined: 30 Jun 14 Posts: 127 Credit: 110,756,939 RAC: 4,306 Level Scientific publications | |
|
Just suffered DPC_WATCHDOG_VIOLATION on my system. Will be offline ba few days. | |
| ID: 53224 | Rating: 0 | rate:
| |
|
Retvari Zoltan Send message Joined: 20 Jan 09 Posts: 2343 Credit: 16,201,255,749 RAC: 0 Level Scientific publications | |
These workunits has failed on all 8 hosts with this error condition. initial_1923-ELISA_GSN4V1-12-100-RND5980 initial_1086-ELISA_GSN0V1-2-100-RND9613 Perhaps these workunits inherited a NaN (=Not a Number) from their previous stage. I don't think this could be solved by a reboot. I'm eagerly waiting to see how many batches will survive through all the 100 stages. | |
| ID: 53225 | Rating: 0 | rate:
| |
|
Bedrich Hajek Send message Joined: 28 Mar 09 Posts: 477 Credit: 9,338,822,716 RAC: 10,910,487 Level Scientific publications | |
|
I ran the following unit: | |
| ID: 53290 | Rating: 0 | rate:
| |
|
Keith Myers Send message Joined: 13 Dec 17 Posts: 1313 Credit: 6,018,992,459 RAC: 10,024,692 Level Scientific publications | |
|
I must have squeaked in under the wire by just this much with this GERARD_pocket_discovery task. | |
| ID: 53291 | Rating: 0 | rate:
| |
|
Bedrich Hajek Send message Joined: 28 Mar 09 Posts: 477 Credit: 9,338,822,716 RAC: 10,910,487 Level Scientific publications | |
I must have squeaked in under the wire by just this much with this GERARD_pocket_discovery task. Apparently, these units vary in length. Here is another one with the same problem: http://www.gpugrid.net/workunit.php?wuid=16894092 | |
| ID: 53293 | Rating: 0 | rate:
| |
|
Richard Haselgrove Send message Joined: 11 Jul 09 Posts: 1589 Credit: 6,677,394,351 RAC: 9,116,452 Level Scientific publications | |
|
I've got one running from 1_5-GERARD_pocket_discovery_d89241c4_7afa_4928_b469_bad3dc186521-0-2-RND2573 - I'll try to catch some figures to see how bad the problem is. <max_nbytes>256000000.000000</max_nbytes> or 256,000,000 bytes. You'd have thought that was enough. | |
| ID: 53294 | Rating: 0 | rate:
| |
|
Toni Volunteer moderator Project administrator Project developer Project tester Project scientist Send message Joined: 9 Dec 08 Posts: 1006 Credit: 5,068,599 RAC: 0 Level Scientific publications | |
|
The 256 MB is the new limit - I raised it today. There are only a handful of WUs like that. | |
| ID: 53295 | Rating: 0 | rate:
| |
|
Richard Haselgrove Send message Joined: 11 Jul 09 Posts: 1589 Credit: 6,677,394,351 RAC: 9,116,452 Level Scientific publications | |
|
I put precautions in place, but you beat me to it - final file size was 155,265,144 bytes. Plenty of room. Uploading now. | |
| ID: 53301 | Rating: 0 | rate:
| |
|
Erich56 Send message Joined: 1 Jan 15 Posts: 1105 Credit: 7,822,620,176 RAC: 1,815,365 Level Scientific publications | |
|
what I also noticed with the GERARD tasks (currently is running 0_2-GERARD_pocket_discovery ...): | |
| ID: 53303 | Rating: 0 | rate:
| |
God is Love, JC proves it...  Send message Joined: 24 Nov 11 Posts: 30 Credit: 200,733,758 RAC: 1,151 Level Scientific publications | |
|
I am getting upload errors too, on most but not all (4 of 6) WUs... need to increase the size limits of the output files So, how is this done? Via the Options, Computing preferences, under Network, the default values are not shown (that I can see). I WOULD have assumed that boinc manager would have these as only limited by the system constraints unless tighter limits are desired. AND, only download rate, upload rate, and usage limits can be set. Again, how should output file size limits be increased. It would have been VERY polite of GpuGrid to post some notice about this with the new WU releases. I am very miffed, and justifiably so, at having wasted so much of my GPU time and energy, and effort on my part to hunt down the problem. Indeed, there was NO feedback from GpuGrid on this at all; I only noticed that my RAC kept falling even though I was running WUs pretty much nonstop. I realize that getting research done is the primary goal, but if GpuGrid is asking people to donate their PC time and GPU time, then please be more polite to your donors. LLP, PhD | |
| ID: 53316 | Rating: 0 | rate:
| |
|
Keith Myers Send message Joined: 13 Dec 17 Posts: 1313 Credit: 6,018,992,459 RAC: 10,024,692 Level Scientific publications | |
|
You can't control the result output file. That is set by the science application under control of the project administrators. The quote you referenced was from Toni acknowledging that he needed to increase the size of the upload server input buffer to handle the larger result files that a few tasks were producing. Not the norm of the usual work we have processed so far. Should be rare cases the results files exceed 250MB. | |
| ID: 53317 | Rating: 0 | rate:
| |
|
Richard Haselgrove Send message Joined: 11 Jul 09 Posts: 1589 Credit: 6,677,394,351 RAC: 9,116,452 Level Scientific publications | |
|
Neither of those two. The maximum file size is specified in the job specification associated with the task in question. You can (as I did) increase the maximum size by careful editing of the file 'client_state.xml', but it needs a steady hand, some knowledge, and is not for the faint of heart. It shouldn't be needed now, after Toni's correction at source. | |
| ID: 53320 | Rating: 0 | rate:
| |
|
God is Love, JC proves it... Send message Joined: 24 Nov 11 Posts: 30 Credit: 200,733,758 RAC: 1,151 Level Scientific publications | |
|
Hm, | |
| ID: 53321 | Rating: 0 | rate:
| |
|
God is Love, JC proves it... Send message Joined: 24 Nov 11 Posts: 30 Credit: 200,733,758 RAC: 1,151 Level Scientific publications | |
|
Besides the upload errors, | |
| ID: 53322 | Rating: 0 | rate:
| |
|
Richard Haselgrove Send message Joined: 11 Jul 09 Posts: 1589 Credit: 6,677,394,351 RAC: 9,116,452 Level Scientific publications | |
Hm, That's a different error. Toni's post was about a file size error. | |
| ID: 53325 | Rating: 0 | rate:
| |
|
Toni Volunteer moderator Project administrator Project developer Project tester Project scientist Send message Joined: 9 Dec 08 Posts: 1006 Credit: 5,068,599 RAC: 0 Level Scientific publications | |
Besides the upload errors, Such messages are always present in Windows. They are not related to successful or not termination. If an error message is present, it's elsewhere in the output. | |
| ID: 53326 | Rating: 0 | rate:
| |
|
Toni Volunteer moderator Project administrator Project developer Project tester Project scientist Send message Joined: 9 Dec 08 Posts: 1006 Credit: 5,068,599 RAC: 0 Level Scientific publications | |
|
Also, slow and mobile cards should not be used for crunching for the reasons you mention. | |
| ID: 53327 | Rating: 0 | rate:
| |
|
Hi, | |
| ID: 53328 | Rating: 0 | rate:
| |
|
Carlos Augusto Engel Send message Joined: 5 Jun 09 Posts: 38 Credit: 2,880,758,878 RAC: 0 Level Scientific publications | |
|
Hello, | |
| ID: 53329 | Rating: 0 | rate:
| |
|
Aurum Send message Joined: 12 Jul 17 Posts: 400 Credit: 13,832,764,882 RAC: 30,787,057 Level Scientific publications | |
I have not received any new WU in like 30-40 days.Why?Did you check ACEMD3 in Prefs? | |
| ID: 53330 | Rating: 0 | rate:
| |
|
Bedrich Hajek Send message Joined: 28 Mar 09 Posts: 477 Credit: 9,338,822,716 RAC: 10,910,487 Level Scientific publications | |
|
I have another observation to add. One of my computers had an abrupt shutdown (in words, the power was shut off, accidentally, off course), while crunching this unit: initial_1609-ELISA_GSN4V1-19-100-RND7717_0. Upon restart, the unit finished as valid. Which would not have happened with the previous ACEMD app. See link: | |
| ID: 53338 | Rating: 0 | rate:
| |
|
Erich56 Send message Joined: 1 Jan 15 Posts: 1105 Credit: 7,822,620,176 RAC: 1,815,365 Level Scientific publications | |
I have another observation to add. One of my computers had an abrupt shutdown (in words, the power was shut off, accidentally, off course) now that you are saying this - I had a similar situation with one my hosts 2 days ago. The PC shut down and restarted. I had/have no idea whether this was caused by crunching a GPUGRID task or whether there was any other reasond behind that. | |
| ID: 53339 | Rating: 0 | rate:
| |
|
Greg _BE Send message Joined: 30 Jun 14 Posts: 127 Credit: 110,756,939 RAC: 4,306 Level Scientific publications | |
|
After solving the windows problem and fighting with the MOBO and Windows some more, my system is stable. | |
| ID: 53345 | Rating: 0 | rate:
| |
|
rod4x4 Send message Joined: 4 Aug 14 Posts: 266 Credit: 2,219,935,054 RAC: 0 Level Scientific publications | |
What is error -44 (0xffffffd4)? This is a date issue on your computer. Is your date correct? Can also be associated with Nvidia license issues but we haven't see that recently. And all it does is repeat this message: GPU [GeForce GTX 1050 Ti] Platform [Windows] Rev [3212] VERSION [80] This is STDerr output from ACEMD2 tasks, not the current ACEMD3 tasks. I cant see any failed tasks on your account, do you have a link to the host or Work unit generating this error? | |
| ID: 53348 | Rating: 0 | rate:
| |
|
ServicEnginIC Send message Joined: 24 Sep 10 Posts: 572 Credit: 7,516,447,024 RAC: 10,464,686 Level Scientific publications | |
|
Also, Toni has given some general guidelines at his FAQ - Acemd3 application thread. | |
| ID: 53351 | Rating: 0 | rate:
| |
|
Greg _BE Send message Joined: 30 Jun 14 Posts: 127 Credit: 110,756,939 RAC: 4,306 Level Scientific publications | |
What is error -44 (0xffffffd4)? Clock date is correct. Link http://www.gpugrid.net/result.php?resultid=18119786 and http://www.gpugrid.net/result.php?resultid=18126912 | |
| ID: 53356 | Rating: 0 | rate:
| |
|
Greg _BE Send message Joined: 30 Jun 14 Posts: 127 Credit: 110,756,939 RAC: 4,306 Level Scientific publications | |
Also, Toni has given some general guidelines at his FAQ - Acemd3 application thread. Hmm..have to see what those do when I get them. Right now I am OC'd to the max on my 1050TI. If I see this stuff show up on my system then I better turn it back to default. Still running version 2 stuff. | |
| ID: 53357 | Rating: 0 | rate:
| |
|
rod4x4 Send message Joined: 4 Aug 14 Posts: 266 Credit: 2,219,935,054 RAC: 0 Level Scientific publications | |
Clock date is correct. First link is from 17th July 2018 Second Link is from 19th July 2018 Yes, there were issues for all volunteers in July 2018. Do you have any recent errors? | |
| ID: 53358 | Rating: 0 | rate:
| |
|
William Lathan Send message Joined: 13 Jul 18 Posts: 2 Credit: 15,041,475 RAC: 0 Level Scientific publications | |
|
Where in prefs do you find this options? | |
| ID: 53361 | Rating: 0 | rate:
| |
|
Aurum Send message Joined: 12 Jul 17 Posts: 400 Credit: 13,832,764,882 RAC: 30,787,057 Level Scientific publications | |
Where in prefs do you find this options?Click your username link at the top of the page. Then click GPUGrid Preferences. Then click Edit GPUGrid Preferences. Then check the box ACEMD3. Then click Update Preferences. Then you'll get WUs when they're available. Right now there's not much work so I get only one or two WUs a day. ____________ | |
| ID: 53362 | Rating: 0 | rate:
| |
|
William Lathan Send message Joined: 13 Jul 18 Posts: 2 Credit: 15,041,475 RAC: 0 Level Scientific publications | |
|
Many thanks. I modified the settings and now we'll see. Thanks again, Bill | |
| ID: 53363 | Rating: 0 | rate:
| |
|
Greg _BE Send message Joined: 30 Jun 14 Posts: 127 Credit: 110,756,939 RAC: 4,306 Level Scientific publications | |
Clock date is correct. No..sorry for the confusion. Just a validate error. But no running errors yet. Most current task is in queue to start again and sitting at 38%. I have a 8 hr cycle currently. I thought I had seen a task show up in BOINC as an error. Must have been a different project. Oh well. I could do without all the errors. My system has been driving me crazy earlier. So I am ok for now. Thanks for the pointer on the date. | |
| ID: 53364 | Rating: 0 | rate:
| |
|
Pop Piasa Send message Joined: 8 Aug 19 Posts: 252 Credit: 458,054,251 RAC: 0 Level Scientific publications | |
|
"I have not received any new WU in like 30-40 days." | |
| ID: 53366 | Rating: 0 | rate:
| |
|
Hi, bar is empty and my gpu is thirsty. Some news about new batch to crunch? :-) | |
| ID: 53368 | Rating: 0 | rate:
| |
|
KAMasud Send message Joined: 27 Jul 11 Posts: 137 Credit: 523,901,354 RAC: 0 Level Scientific publications | |
Hi, bar is empty and my gpu is thirsty. Some news about new batch to crunch? :-) Second that. | |
| ID: 53382 | Rating: 0 | rate:
| |
|
KAMasud Send message Joined: 27 Jul 11 Posts: 137 Credit: 523,901,354 RAC: 0 Level Scientific publications | |
"I have not received any new WU in like 30-40 days." If you are running other projects, especially Collatz Then you will have to manually control them or Boinc will report cache full, no tasks required. Collatz is prone to flooding the machine with WU's. I have given it one per cent resources, even then it floods my machine. You have to fish for GPUGRID WU's these days. Starve the queue and let the computer hammer at the server itself. | |
| ID: 53383 | Rating: 0 | rate:
| |
|
Greg _BE Send message Joined: 30 Jun 14 Posts: 127 Credit: 110,756,939 RAC: 4,306 Level Scientific publications | |
|
If you run empty, then go look at the server status. Current server status says there is no work. Also if you check your notices in BOINC manager you will see that it communicates to the project and the project reports back no work to send. | |
| ID: 53384 | Rating: 0 | rate:
| |
|
Pop Piasa Send message Joined: 8 Aug 19 Posts: 252 Credit: 458,054,251 RAC: 0 Level Scientific publications | |
|
Thanks very much, KAMasud. That clarifies it completely. The "no new tasks" and "suspend" buttons have already proven useful to me during my brief time volunteering on BOINC. | |
| ID: 53385 | Rating: 0 | rate:
| |
|
ExtraTerrestrial Apes Volunteer moderator Volunteer tester Send message Joined: 17 Aug 08 Posts: 2705 Credit: 1,311,122,549 RAC: 0 Level Scientific publications | |
|
I have set GPU-Grid as my main project and Einstein as second project with 1% the ressource share of GPU-Grid. Works well for me: if there is GPU-Grid work, my machine keeps asking for it and runs it with priority over any Einstein task I have in my buffer. And there are always a few but never too many Einstein task in my buffer. And I'm using a rather short buffer (4h or so) to avoid flooding with backup tasks. | |
| ID: 53387 | Rating: 0 | rate:
| |
|
Aurum Send message Joined: 12 Jul 17 Posts: 400 Credit: 13,832,764,882 RAC: 30,787,057 Level Scientific publications | |
Asteroids project is also out of available jobs.With Asteroids it's feast or famine. Any day they'll toss up a million WUs and then let it run dry again. It's a nice project since it only needs 0.01 CPU and it's CUDA55 so works good on legacy GPUs. | |
| ID: 53388 | Rating: 0 | rate:
| |
|
Pop Piasa Send message Joined: 8 Aug 19 Posts: 252 Credit: 458,054,251 RAC: 0 Level Scientific publications | |
|
Thanks for the tips ETApes & everyone. | |
| ID: 53389 | Rating: 0 | rate:
| |
|
Greg _BE Send message Joined: 30 Jun 14 Posts: 127 Credit: 110,756,939 RAC: 4,306 Level Scientific publications | |
|
Since this project is so sporadic, I'll leave it at 150% resource share and if something new shows up I'll get 3-4 out of the whole batch. | |
| ID: 53390 | Rating: 0 | rate:
| |
|
Erich56 Send message Joined: 1 Jan 15 Posts: 1105 Credit: 7,822,620,176 RAC: 1,815,365 Level Scientific publications | |
|
just had another task which errored out with | |
| ID: 53391 | Rating: 0 | rate:
| |
|
Bedrich Hajek Send message Joined: 28 Mar 09 Posts: 477 Credit: 9,338,822,716 RAC: 10,910,487 Level Scientific publications | |
|
I had this error, and so did everyone else: | |
| ID: 53392 | Rating: 0 | rate:
| |
|
Keith Myers Send message Joined: 13 Dec 17 Posts: 1313 Credit: 6,018,992,459 RAC: 10,024,692 Level Scientific publications | |
|
Likely an error in retrieving the task from the server. Bad index on the server for the file. Error is in the Management Data Input module which deals with serial communication for example in the ethernet protocol. | |
| ID: 53393 | Rating: 0 | rate:
| |
|
Toni Volunteer moderator Project administrator Project developer Project tester Project scientist Send message Joined: 9 Dec 08 Posts: 1006 Credit: 5,068,599 RAC: 0 Level Scientific publications | |
|
The previous-step WU created a corrupted output file. This is used as an input in the next workunit, which therefore fails on start. | |
| ID: 53394 | Rating: 0 | rate:
| |
|
Can we have more details on this GSN Project? | |
| ID: 53423 | Rating: 0 | rate:
| |
|
Keith Myers Send message Joined: 13 Dec 17 Posts: 1313 Credit: 6,018,992,459 RAC: 10,024,692 Level Scientific publications | |
|
Think this is a case of a bad work unit again. <core_client_version>7.16.3</core_client_version> <![CDATA[ <message> process exited with code 195 (0xc3, -61)</message> <stderr_txt> 15:18:37 (20880): wrapper (7.7.26016): starting 15:18:37 (20880): wrapper (7.7.26016): starting 15:18:37 (20880): wrapper: running acemd3 (--boinc input --device 1) ERROR: /home/user/conda/conda-bld/acemd3_1570536635323/work/src/mdsim/trajectory.cpp line 129: Incorrect XSC file 15:18:41 (20880): acemd3 exited; CPU time 3.067561 15:18:41 (20880): app exit status: 0x9e 15:18:41 (20880): called boinc_finish(195) </stderr_txt> ]]> | |
| ID: 53445 | Rating: 0 | rate:
| |
|
Erich56 Send message Joined: 1 Jan 15 Posts: 1105 Credit: 7,822,620,176 RAC: 1,815,365 Level Scientific publications | |
... what exactly is an XSC file ? | |
| ID: 53446 | Rating: 0 | rate:
| |
|
Toni Volunteer moderator Project administrator Project developer Project tester Project scientist Send message Joined: 9 Dec 08 Posts: 1006 Credit: 5,068,599 RAC: 0 Level Scientific publications | |
|
It's part of the state which is carried between one simulation piece and the next. | |
| ID: 53447 | Rating: 0 | rate:
| |
|
Hi: | |
| ID: 53459 | Rating: 0 | rate:
| |
|
Keith Myers Send message Joined: 13 Dec 17 Posts: 1313 Credit: 6,018,992,459 RAC: 10,024,692 Level Scientific publications | |
|
Uhh, the floodgates have opened. I'm being inundated with work units. | |
| ID: 53460 | Rating: 0 | rate:
| |
|
Hi: | |
| ID: 53487 | Rating: 0 | rate:
| |
|
Werinbert Send message Joined: 12 May 13 Posts: 5 Credit: 100,032,540 RAC: 0 Level Scientific publications | |
|
I really wish GPUGRID would spread out the work units among all the volunteers rather than give big bunches of WUs to a few volunteers. | |
| ID: 53510 | Rating: 0 | rate:
| |
|
Toni Volunteer moderator Project administrator Project developer Project tester Project scientist Send message Joined: 9 Dec 08 Posts: 1006 Credit: 5,068,599 RAC: 0 Level Scientific publications | |
I really wish GPUGRID would spread out the work units among all the volunteers rather than give big bunches of WUs to a few volunteers. We don't do a selection. When "bursts" of WUs are created, the already connected users tend to get them. This said, if the host does not meet all criteria (e.g. driver version), it won't get WUs, but there is no explanation why. This is an unfortunate consequence of the BOINC machinery and out of our control. | |
| ID: 53512 | Rating: 0 | rate:
| |
|
So much for opening the floodgates of GPU WUs to my disappointment I only received 4 workunits. I do not know whether GPUGRID.NET is a victim of its own success, I thought I could use my fast GPU to advance medical research while I am doing my emails and other other tasks. | |
| ID: 53518 | Rating: 0 | rate:
| |
|
JStateson Send message Joined: 31 Oct 08 Posts: 186 Credit: 3,343,411,800 RAC: 22,497 Level Scientific publications | |
|
=====INCREDIBLE - GOT A BOATLOAD - all 6 GPUs are crunching========== | |
| ID: 53533 | Rating: 0 | rate:
| |
|
Toni Volunteer moderator Project administrator Project developer Project tester Project scientist Send message Joined: 9 Dec 08 Posts: 1006 Credit: 5,068,599 RAC: 0 Level Scientific publications | |
|
| |
| ID: 53535 | Rating: 0 | rate:
| |
So much for opening the floodgates of GPU WUs to my disappointment I only received 4 workunits. I do not know whether GPUGRID.NET is a victim of its own success, I thought I could use my fast GPU to advance medical research while I am doing my emails and other other tasks. I only get 2 at a time, my GPU has been busy all day! ____________ | |
| ID: 53536 | Rating: 0 | rate:
| |
|
microchip Send message Joined: 4 Sep 11 Posts: 110 Credit: 326,102,587 RAC: 0 Level Scientific publications | |
|
When can we expect a solid number of WUs again? I'm dry here, pour me a drink! ;) | |
| ID: 53581 | Rating: 0 | rate:
| |
|
Shayol Ghul Send message Joined: 11 Aug 17 Posts: 2 Credit: 1,024,938,819 RAC: 0 Level Scientific publications | |
|
Where are the work units? | |
| ID: 53583 | Rating: 0 | rate:
| |
|
Werkstatt Send message Joined: 23 May 09 Posts: 121 Credit: 322,440,386 RAC: 467 Level Scientific publications | |
Where are the work units? I hoped you could tell me ... | |
| ID: 53594 | Rating: 0 | rate:
| |
|
If you are looking for GPU WUs, head over to Folding@Home. I am there right now and there is plenty of GPU WUs to keep your GPU busy 24/7. | |
| ID: 53595 | Rating: 0 | rate:
| |
|
Toni Volunteer moderator Project administrator Project developer Project tester Project scientist Send message Joined: 9 Dec 08 Posts: 1006 Credit: 5,068,599 RAC: 0 Level Scientific publications | |
|
Hang on | |
| ID: 53596 | Rating: 0 | rate:
| |
|
gravitonian Send message Joined: 24 May 13 Posts: 3 Credit: 20,738,042 RAC: 0 Level Scientific publications | |
This said, if the host does not meet all criteria (e.g. driver version), it won't get WUs, but there is no explanation why. This is an unfortunate consequence of the BOINC machinery and out of our control. How to find out if the computer meets requirements? I have a gtx 1660 super and latest drivers, but I can’t get any wu for a month. | |
| ID: 53597 | Rating: 0 | rate:
| |
|
Aurum Send message Joined: 12 Jul 17 Posts: 400 Credit: 13,832,764,882 RAC: 30,787,057 Level Scientific publications | |
If you are looking for GPU WUs, head over to Folding@Home. I am there right now and there is plenty of GPU WUs to keep your GPU busy 24/7. Their software is too buggy to waste my time. F@H should come over to BOINC. | |
| ID: 53599 | Rating: 0 | rate:
| |
|
Aurum Send message Joined: 12 Jul 17 Posts: 400 Credit: 13,832,764,882 RAC: 30,787,057 Level Scientific publications | |
This said, if the host does not meet all criteria (e.g. driver version), it won't get WUs, but there is no explanation why. This is an unfortunate consequence of the BOINC machinery and out of our control. Do you have a recent driver with cuda10 and did you check the ACEMD3 box in Prefs? | |
| ID: 53600 | Rating: 0 | rate:
| |
|
gravitonian Send message Joined: 24 May 13 Posts: 3 Credit: 20,738,042 RAC: 0 Level Scientific publications | |
|
Yes, cuda version 10.2 and ACEMD3 box picked. | |
| ID: 53602 | Rating: 0 | rate:
| |
|
Bedrich Hajek Send message Joined: 28 Mar 09 Posts: 477 Credit: 9,338,822,716 RAC: 10,910,487 Level Scientific publications | |
If you are looking for GPU WUs, head over to Folding@Home. I am there right now and there is plenty of GPU WUs to keep your GPU busy 24/7. This is true. I had to reinstall the software after it stopped working several time. F@H should come over to BOINC. That's is highly unlikely, since University of California at Berkeley and Stanford University are arch rivals. | |
| ID: 53604 | Rating: 0 | rate:
| |
If you are looking for GPU WUs, head over to Folding@Home. I am there right now and there is plenty of GPU WUs to keep your GPU busy 24/7. So, there's BOINC and....Stanford doesn't have a dog in this fight. If they ever had to do a major rework of their software, I'd bet they would look closely at BOINC! ____________ | |
| ID: 53610 | Rating: 0 | rate:
| |
|
If you are looking for GPU WUs, head over to Folding@Home. I am there right now and there is plenty of GPU WUs to keep your GPU busy 24/7. | |
| ID: 53616 | Rating: 0 | rate:
| |
|
Aurum Send message Joined: 12 Jul 17 Posts: 400 Credit: 13,832,764,882 RAC: 30,787,057 Level Scientific publications | |
With reference to the gentleman claiming that F@H is too buggy, I have never had to reinstall the Folding@Home s/w. Apparently I'm not the only one that thinks so and voted with their feet (click Monthly): https://folding.extremeoverclocking.com/team_summary.php?s=&t=224497 | |
| ID: 53617 | Rating: 0 | rate:
| |
|
Pop Piasa Send message Joined: 8 Aug 19 Posts: 252 Credit: 458,054,251 RAC: 0 Level Scientific publications | |
|
@ Gravitonian ===> Are you running more than one GPU project? | |
| ID: 53618 | Rating: 0 | rate:
| |
|
ServicEnginIC Send message Joined: 24 Sep 10 Posts: 572 Credit: 7,516,447,024 RAC: 10,464,686 Level Scientific publications | |
|
On February 3rd 2020 Toni wrote at this same thread: | |
| ID: 53684 | Rating: 0 | rate:
| |
|
pututu Send message Joined: 8 Oct 16 Posts: 15 Credit: 930,526,869 RAC: 18,616,142 Level Scientific publications | |
|
Looking at the server status stat page: | |
| ID: 53687 | Rating: 0 | rate:
| |
|
pututu Send message Joined: 8 Oct 16 Posts: 15 Credit: 930,526,869 RAC: 18,616,142 Level Scientific publications | |
|
Looking at the server status stat page: | |
| ID: 53688 | Rating: 0 | rate:
| |
|
Toni Volunteer moderator Project administrator Project developer Project tester Project scientist Send message Joined: 9 Dec 08 Posts: 1006 Credit: 5,068,599 RAC: 0 Level Scientific publications | |
Thanks for the calculations. New tasks are automatically generated 1:1 when existing ones finish, until approx. 10x the current load. | |
| ID: 53689 | Rating: 0 | rate:
| |
|
pututu Send message Joined: 8 Oct 16 Posts: 15 Credit: 930,526,869 RAC: 18,616,142 Level Scientific publications | |
Awesome. I think having at least 3 days of task or more will keep the GPU cards busy and the crunchers happy. | |
| ID: 53690 | Rating: 0 | rate:
| |
|
SolidAir79 Send message Joined: 22 Aug 19 Posts: 7 Credit: 168,393,363 RAC: 0 Level Scientific publications | |
|
First hello, im crunching for the TSBT ,I'm getting errors probably 1 in 5 of the wu's here is one of the messages: | |
| ID: 53692 | Rating: 0 | rate:
| |
|
Keith Myers Send message Joined: 13 Dec 17 Posts: 1313 Credit: 6,018,992,459 RAC: 10,024,692 Level Scientific publications | |
# Engine failed: Particle coordinate is nan Unless the task itself is misformulated, and you can check with others running the same series, the error says the card made a math error. Too far overclocked or not enough cooling and the card is running hot. | |
| ID: 53695 | Rating: 0 | rate:
| |
|
SolidAir79 Send message Joined: 22 Aug 19 Posts: 7 Credit: 168,393,363 RAC: 0 Level Scientific publications | |
|
Temps not an issue will try lowering the clocks cheers | |
| ID: 53696 | Rating: 0 | rate:
| |
|
Is it normal for the credits to be much lower than with the old version? | |
| ID: 53697 | Rating: 0 | rate:
| |
|
Keith Myers Send message Joined: 13 Dec 17 Posts: 1313 Credit: 6,018,992,459 RAC: 10,024,692 Level Scientific publications | |
Is it normal for the credits to be much lower than with the old version? Yes, the credit awarded is scaled to the GFLOPS required to crunch the task or roughly equivalent to the time it takes to crunch. The old tasks with the old app ran for several more hours apiece compared to the current work. | |
| ID: 53700 | Rating: 0 | rate:
| |
|
SolidAir79 Send message Joined: 22 Aug 19 Posts: 7 Credit: 168,393,363 RAC: 0 Level Scientific publications | |
Temps not an issue will try lowering the clocks cheers Seems to have worked cheers funny though benchmarked the card played games and crunched on other projects with no issue but no errors so far so good! | |
| ID: 53708 | Rating: 0 | rate:
| |
Is it normal for the credits to be much lower than with the old version? Yes, I understand shorter work units will grant less credit, I meant during the course of a day. I am getting roughly half or less PPD than with the older longer units. | |
| ID: 53709 | Rating: 0 | rate:
| |
|
Toni Volunteer moderator Project administrator Project developer Project tester Project scientist Send message Joined: 9 Dec 08 Posts: 1006 Credit: 5,068,599 RAC: 0 Level Scientific publications | |
|
The old MDAD WUs miscalculated credits. | |
| ID: 53710 | Rating: 0 | rate:
| |
The old MDAD WUs miscalculated credits. Are those the old ACEMD Long Runs WU's? I am getting about half as much PPD on the New Version of ACEMD vs the Long Runs wu's on the previous version. | |
| ID: 53717 | Rating: 0 | rate:
| |
|
Keith Myers Send message Joined: 13 Dec 17 Posts: 1313 Credit: 6,018,992,459 RAC: 10,024,692 Level Scientific publications | |
The old MDAD WUs miscalculated credits. No, completely different application and different tasks. No relationship to previous work. | |
| ID: 53718 | Rating: 0 | rate:
| |
|
Pop Piasa Send message Joined: 8 Aug 19 Posts: 252 Credit: 458,054,251 RAC: 0 Level Scientific publications | |
The old MDAD WUs miscalculated credits. ...But it was fun while it lasted! 💸📈 | |
| ID: 53733 | Rating: 0 | rate:
| |
The old MDAD WUs miscalculated credits. So it is normal to get fewer credits per day than with the old Long run WU's? I am just wondering if I am the only one, thats all. | |
| ID: 53761 | Rating: 0 | rate:
| |
|
Keith Myers Send message Joined: 13 Dec 17 Posts: 1313 Credit: 6,018,992,459 RAC: 10,024,692 Level Scientific publications | |
The old MDAD WUs miscalculated credits. Yes. | |
| ID: 53762 | Rating: 0 | rate:
| |
|
Hello, 04/03/2020 14:36:06 | | Fetching configuration file from http://www.gpugrid.net/get_project_config.php 04/03/2020 14:36:49 | GPUGRID | Master file download succeeded 04/03/2020 14:36:54 | GPUGRID | Sending scheduler request: Project initialization. 04/03/2020 14:36:54 | GPUGRID | Requesting new tasks for CPU and NVIDIA GPU and Intel GPU 04/03/2020 14:36:56 | GPUGRID | Scheduler request completed: got 0 new tasks 04/03/2020 14:36:56 | GPUGRID | No tasks sent 04/03/2020 14:36:58 | GPUGRID | Started download of logogpugrid.png 04/03/2020 14:36:58 | GPUGRID | Started download of project_1.png 04/03/2020 14:36:58 | GPUGRID | Started download of project_2.png 04/03/2020 14:36:58 | GPUGRID | Started download of project_3.png 04/03/2020 14:36:59 | GPUGRID | Finished download of logogpugrid.png 04/03/2020 14:36:59 | GPUGRID | Finished download of project_1.png 04/03/2020 14:36:59 | GPUGRID | Finished download of project_2.png 04/03/2020 14:36:59 | GPUGRID | Finished download of project_3.png 04/03/2020 14:37:31 | GPUGRID | Sending scheduler request: To fetch work. 04/03/2020 14:37:31 | GPUGRID | Requesting new tasks for CPU and NVIDIA GPU and Intel GPU 04/03/2020 14:37:32 | GPUGRID | Scheduler request completed: got 0 new tasks 04/03/2020 14:37:32 | GPUGRID | No tasks sent Do you have any idea ? Best Regards, Wilgard | |
| ID: 53849 | Rating: 0 | rate:
| |
|
Jim1348 Send message Joined: 28 Jul 12 Posts: 819 Credit: 1,591,285,971 RAC: 0 Level Scientific publications | |
I have just add GPUGRID as a new projet in BOINC. Check your card and drivers. One or both may be too old. http://www.gpugrid.net/forum_thread.php?id=5002#52865 | |
| ID: 53850 | Rating: 0 | rate:
| |
|
Ian&Steve C. Send message Joined: 21 Feb 20 Posts: 1048 Credit: 40,228,383,983 RAC: 547,485 Level Scientific publications | |
|
looks like Windows only has CUDA92 and CUDA101 apps. his driver version (382.xx) is only compatible with CUDA80. | |
| ID: 53852 | Rating: 0 | rate:
| |
|
I am really imppresed. That was the issue I had. | |
| ID: 53863 | Rating: 0 | rate:
| |
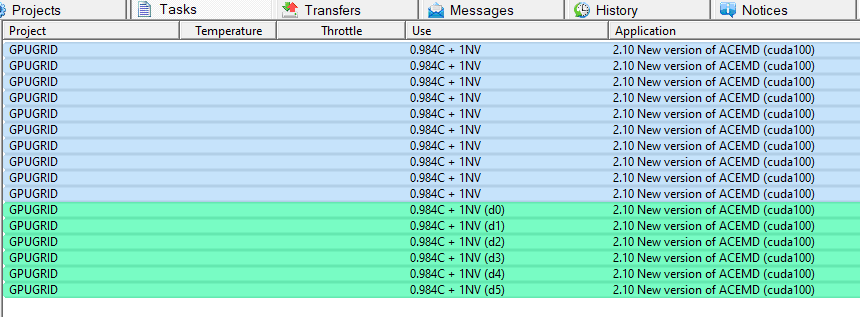


Message boards : News : New workunits